I wrote the first part of this blog around 8 weeks ago and left you with some food for thought. Go back and have another quick 5-minute read if you like, but in essence I showed that a (rather spuriously) diversified portfolio that had performed very well for 35 years (1975 to 2010) had generated some rather disappointing results over the period 2011-2021, even on a risk-adjusted basis. As a reminder these were the results:
S&P500 vs my Diverse portfolio 2011 to 2021
|
S&P 500 |
|
|---|---|
|
annualised return |
13.3% |
|
standard deviation |
13.4% |
|
return / risk |
0.99 |
|
Diverse Portfolio |
|
|
annualised return |
6.9% |
|
standard deviation |
9.1% |
|
return / risk |
0.75 |
The question I also left you with is: how would an optimised portfolio have performed? Well, with exactly the same investable assets (all invested through iShares – S&P500, Mid-cap, Small-cap, EAFE, GSCI, REITs, IG bonds and Tsy bonds) the best I could have achieved is a Return/Risk ratio of 1.22 over the same period. I could just have achieved this result by adjusting the weightings of each asset in my portfolio:
|
Annualised Return |
8.00% |
|
Standard Deviation |
6.58% |
|
Return/Risk* |
1.22 |
*a more ‘sophisticated’ measure of performance would be the Sharpe Ratio that only measures the outperformance of the portfolio over a risk-free asset, and the StdDev of that outperformance. The above ‘crude’ version is a good proxy in current conditions when risk-free yields are pretty close zero, or even negative!
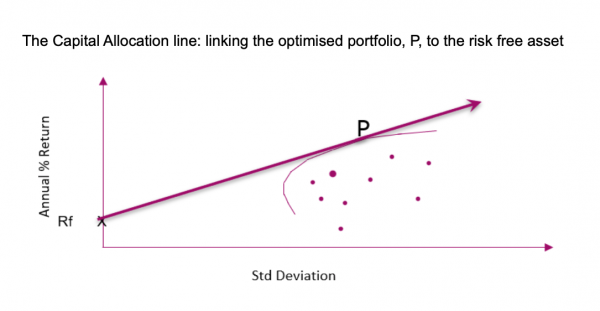
Although this is a lower-return result, it is the most ‘efficient’ portfolio with the highest return-to-risk ratio of 1.22. If the return isn’t sufficient, in theory I could borrow at a ‘risk free’ rate and leverage up the same portfolio, maintaining my return/risk ratio of 1.22. That is the idea behind the creation of the Capital Allocation Line you read about in portfolio theory.
How does optimisation work?
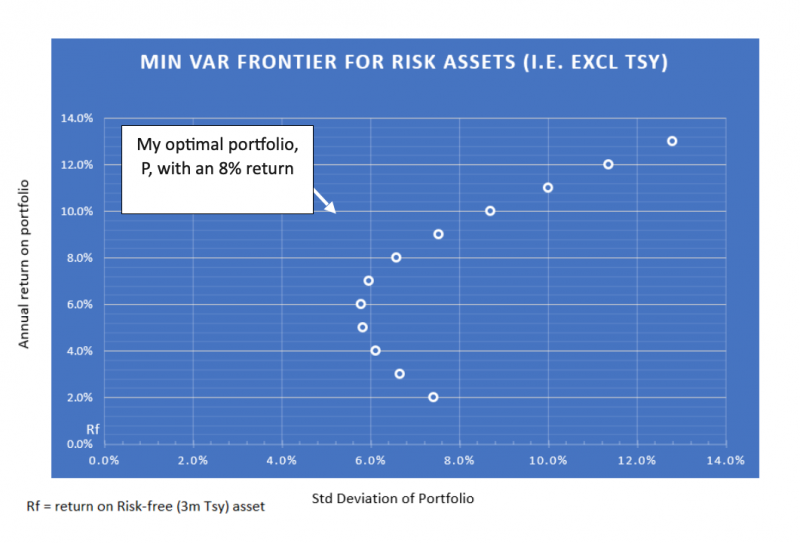
So the question many of you may have is how I arrived at P. Just trial and error? Optimisation of a historic portfolio is a straight-forward process –using Excel’s GRG ‘Solver’ add-in. In Excel, all we do is use this ‘Solver’ tool (in the Data menus once installed) to find the minimum risk for a given return target by adjusting the asset weightings. My analysis was all based on sets of monthly returns data, net of costs, on various iShares® products. So, I can now see what weightings give the minimum risk is for a 2% return, 3% return, 4% etc…. If my returns target is too low, or too high, Excel will not be able to solve.
Once I run the Solver a few times for various target returns, I get a set of portfolio returns which, when plotted against risk, give the familiar elliptical curve of the minimum variance frontier (below).
(I’m going to publish a step-by-step Excel tutorial blog on this process in the coming weeks)
And now a shot of realism
Finding this optimal portfolio turns my mind to the famous game show host Jim Bowen and his catchphrase “Look at what you could’ve won!”. In other words, you didn’t get that return did you?! There is a chance I could have done by pure chance but the odds would have been even greater than those of winning the national lottery). Optimisation relies on both returns and risk (covariances) of multiple asset classes) being available and predictable. Historic data is there, but not a crystal ball.
What’s the use? The principles of optimisation can still inform a better portfolio balance: those principles of expected returns, risks and correlations. I recently read a white paper from ReSolve Asset Management** which starts off with “….It is widely accepted among investment professionals that, while portfolio optimization has compelling theoretical merit, it is not useful in practice. Practitioners are concerned that optimization is an “error maximizing” process fraught with insurmountable estimation issues.”. It says it all. Many would argue that whilst returns are hard to forecast, risks and correlations tend to be more stable. Rather ironic that a risk measure can be more predictable. It’s like car-collision statistics for insurance underwriters – ‘on average’ we can get close.
So where am I left?
Well, I have to question regularly whether what was optimal in the recent past will still be optimal tomorrow. Expected returns and risk are never static.
Ironically, with my practical head on, I’ve reverted back to something rather like the spuriously constructed diverse portfolio that I started with. 60% in diverse equity, then 30% fixed income, 10% REITS, commodities and other alternatives. But this is a strategic allocation, and at the detailed level I am tactically rebalancing based on the current market outlook.
What sort of tactical rebalancing should I be considering? With the Covid pandemic having shaken our economic system to its core, it seems now is a good time to consider this crucial question.
I’m not going to give any advice at any point, just my current personal view…..
The current ‘less-than-favourable’ mix of growth and inflation and higher valuations on riskier assets has left me rather neutral on equities – keeping the exposure, but moving into COVID-cyclicals whilst keeping a balance of higher yielding stocks as we hope to see the vaccine roll-out benefit travel, leisure and other consumer cyclicals.
The low yield and higher inflation environment is just a killer for bonds. But what can stave off those inflationary threats? Well, project finance and the ‘right kind’ of property isn’t a bad start. But keep it liquid! I love my little punt on Barratt Developments plc. It’s only a small part of my portfolio, but it’s a residential land-stock owner, not just a house-builder. The UK isn’t growing (literally) so surely I’m in the right place. A lovely inflation hedge too.
As a bigger picture, I have to consider the longer-term ‘unstoppable’ trends too – many analysts favour the Rise of Asia, Increasing Longevity, Digital Disruption, and New Energy in the long run. It’s hard to ignore.
The devil is in the detail, but remember the devil can be kept at bay off with ongoing rational diversification! Maybe not optimal, but as close as I can get.
** https://investresolve.com/portfolio-optimization-general-framework-lp
Capital City Training runs popular investment and wealth management training programmes in which we show delegates the simplicity and power of investment diversification. If you would like to discuss how we might be able to help you and/or your team, please do connect with us.