Top Statistical Tools Used in Finance and Investment Banking
Statistics plays a crucial role in the financial industry. From investment banks to hedge funds, statistical tools are leveraged to analyse markets, assess risk, build trading strategies and make predictions. This article will provide an overview of the key statistical concepts and techniques used in finance and showcase how they enable effective financial analysis and decision-making.
Some of the most common statistical tools and techniques used in the finance domain include:
- Descriptive Statistics – Measures like mean, median, mode, standard deviation, variance, skewness and kurtosis are used to summarize and describe the characteristics of financial data.
- Probability Distributions – Probability distributions like normal, binomial and Poisson are used to model random variables and quantify likelihood of potential outcomes.
- Hypothesis Testing – Statistical tests like t-tests, ANOVA, chi-square are used to test assumptions and relationships between financial variables.
- Correlation and Regression Analysis – Correlation coefficients, linear regression, multiple regression and logistic regression models are built to identify relationships between variables.
- Time Series Analysis – Methods like ARIMA and GARCH are used to model and forecast trends in financial time series data.
- Monte Carlo Simulations – Random sampling and simulations are run to model probability distributions of potential financial outcomes.
- Statistical Arbitrage – Identifying mispriced assets using statistical models to exploit pricing inefficiencies.
Article Contents
- The Role of Statistics in Investment Banking
- Descriptive Statistics
- Central Tendency Measures
- Variability Measures
- Inferential Statistics
- Hypothesis Testing
- Regression Analysis
- Probability Distributions
- Normal Distribution
- Binomial Distribution
- Time Series Analysis
- Monte Carlo Simulation
- What statistical tools are used where?
- Application of Statistical Measures in Real-world Scenarios
The Role of Statistics in Investment Banking
Investment banks rely heavily on statistical modelling and data analysis to gain insights, identify opportunities and make informed decisions. Some key applications include:
- Risk Management – Statistical tools are used to model market risk, credit risk, liquidity risk and operational risk. Value-at-Risk (VaR) models are built using time series data.
- Algorithmic and High Frequency Trading – Sophisticated statistical models are developed to exploit short-term inefficiencies and price fluctuations in markets.
- Portfolio Optimization – Finding optimal asset allocation to maximize returns given risk appetite using models like Markovitz portfolio theory.
- Asset Pricing and Valuation – Models like CAPM, Black-Scholes and binomial trees are used to value assets and derivatives using statistical analysis.
- Mergers & Acquisitions – Statistical tools are used to evaluate potential merger targets, assess synergies and conduct due diligence.
- Economic Analysis & Forecasting – Macroeconomic indicators are modelled and forecast to predict growth, inflation and fiscal trends.
Descriptive Statistics
Descriptive statistics summarize and describe the characteristics of a dataset. They provide simple summaries about the sample and the measures. Descriptive statistics are applied to give an introductory understanding of the data before diving deeper into more complex statistical analysis.
Central Tendency Measures
Measures of central tendency indicate the centre or typical value of a dataset. Common measures include:
- Mean – The average value, calculated by summing up all values and dividing by the number of values. Provides a sense of the centre of the data. However, can be swayed by outliers.
- Median – The middle value, found by arranging data points from lowest to highest. Not affected by outliers. Used to summarize skewed distributions.
- Mode – The most frequently occurring value in the dataset. Useful for categorical data.
These measures of central tendency are often used by financial analysts to identify average values like average returns, average revenue per customer, average portfolio balance etc. which gives a snapshot of the typical value.
Variability Measures
Variability measures quantify the dispersion or spread of the data. Common measures include:
- Range – Difference between the maximum and minimum values.
- Interquartile Range – Range of values between the first and third quartiles.
- Variance – Average of squared differences from the mean. Closely related to standard deviation but uses squared differences. A similar measure, the semi-variance, focuses alone on downside variations. The ‘squaring’ of the differences gives extra weight to extreme differences.
- Standard Deviation – Square root of the variance. This is the most commonly used measure of variability showing, on average, how far each data point is from the mean. Useful to gauge market volatility. Why square root? Well the variance of, say, a % return will be in units of %2 which is hard to visualise and apply. A standard deviation of that same % return will be measured as a simple %, so much easier to visualise and interpret. For example, a stock may have an average return of 6% over the last 5 years with a standard, or average, deviation of 3%. So, you can interpret that to mean that the returns to have been mostly in the range 6% +/- 3%, so from 3% up to 9%.
Lower variability indicates data points are clustered close to the average, while high variability indicates data is more spread out from the average. Key for measuring investment risk.
Inferential Statistics
While descriptive statistics summarize data, inferential statistics are used to make inferences and generalizations about a broader set of data (the ‘population’) based on a sample. Inferential tools allow analysts to make judgments about investment opportunities.
Hypothesis Testing
Hypothesis testing is used to make statistical decisions using experimental data. It allows drawing conclusions about a hypothesis, or proposal. The steps include:
- Make a null (or proposed) hypothesis and an alternative hypothesis
- Set a significance level (common levels are 5% or 1%). This is a statistical level of how much confidence you want in your conclusions. Eg a 5% significance level means a 95% confidence level.
- Calculate the test statistic like t-statistic or z-score, which depends on the nature of the data you are analysing
- Determine the p-value – probability of obtaining results at least as extreme as observed if null is true. This is based on a computation determined by a standard model that best fits the type of data.
- Compare p-value to significance level – if p-value < significance level, reject null hypothesis (the data does not support the hypothesis)
For example, hypothesis testing can evaluate if a new financial product will be profitable, if an investment strategy can beat market returns or if candidate variables are good predictors of loan default rates. Based on results, business decisions can be made. These tests are used extensively in medical tests too – are the results of using a drug significantly different to a placebo effect?
Regression Analysis
Regression models quantify the relationship between a dependent variable and one or more independent variables. Eg measuring what proportion of share price growth is driven by profit margin, or return on capital, or growth in revenue? Regression coefficients indicate the magnitude and direction of how changes in independent variables impact the dependent variable on average.
- Simple Linear Regression – Single independent variable, provides baseline understanding of relationship. Eg quantifying the relationship between stock price increase and ‘surprise’ earnings
- Multiple Regression – More than one independent variable. This allows us to understanding the impact of each variable, controlling for the others.
Regressions are used extensively in finance to predict outcomes like bond prices, stock returns, demand for loans using historical data. Results help strategize investment decisions.
Probability Distributions
Probability distributions describe the likelihood of random variables taking on different values. Based on parameters like mean and standard deviation, they model patterns exhibited by the data.
Normal Distribution
The normal distribution is the most common continuous probability distribution used in statistical modelling and financial analysis. Some key properties:
- Bell shaped symmetric curve
- Mean, median and mode are equal
- 68-95-99.7 rule – 68% of data within 1 standard deviation of mean, 95% within 2 and 99.7% within 3.
- Used to model stock returns and continuously compounded asset returns
Binomial Distribution
The binomial distribution models outcomes over n independent trials, each with binary outcome of success or failure with fixed probability p of success. Used for modelling discrete scenarios like loan defaults, or contract awards.
Time Series Analysis
Time series analysis is used to understand patterns in data over time. Key techniques include:
- Trend Analysis – Identifying increasing or decreasing secular trends.
- Seasonality Analysis – Detecting repeating seasonal or cyclic patterns.
- Stationarity Tests – Checking if a series has constant statistical properties over time.
- ARIMA Models – Autoregressive Integrated Moving Average models for forecasting future values.
- GARCH Models – Generalized Autoregressive Conditional Heteroskedasticity models for volatility clustering.
Time series analysis is critical in financial forecasting and analysis of trends over time. It provides insights into historical patterns and behaviour which can inform future decision making.
Monte Carlo Simulation
Monte Carlo simulations are computerized analytical techniques that use repeated random sampling and modelling to obtain numerical results. The steps include:
- Define a probability distribution for the inputs based on available data
- Use random sampling to generate thousands of scenarios for the inputs
- Evaluate outcomes for each scenario
- Analyse the results across all simulations
Monte Carlo methods are commonly used in finance for risk management, optimization, asset valuation and portfolio allocation. By running simulations, we can model different market conditions and gain insights about likelihood of outcomes.
What statistical tools are used where?
Financial Modelling
Statistical tools are heavily used in building financial models that simulate real world outcomes. Models like Monte Carlo simulation combine statistics, maths and programming to run simulations using random sampling and probability distributions. Key applications in the finance industry include:
- Risk Modelling – Value at Risk (VaR), credit risk modelling
- Asset Pricing – Options pricing, convertible bond valuation
- Mergers & Acquisitions – Valuation models, synergy analysis
- Portfolio Optimization – Portfolio allocation, diversification strategies
- Economic Forecasting – Interest rates, inflation, unemployment rates
Statistical modelling enables analysing hypothetical scenarios to make data-driven strategic decisions.
Statistical Arbitrage
Statistical arbitrage involves the use of statistical models to identify and exploit pricing inefficiencies between related financial instruments.
Statistical tools are integral to identifying and exploiting pricing inefficiencies in financial markets. Strategies such as statistical arbitrage leverage these tools to capitalise on temporary price discrepancies. Key techniques include:
- Pairs Trading – Using correlation analysis and cointegration tests to identify pairs of securities with historically correlated prices. This approach involves buying the undervalued security and short-selling the overvalued one, betting on the convergence of their prices.
- Mean Reversion Strategies – Implementing models that predict the return of a stock’s price to its historical average, based on statistical measures like the z-score. Or perhaps interest rates reverting back to a historical average over time.
- High-frequency Trading – Employing advanced statistical algorithms to execute a large number of orders at very fast speeds. These algorithms are designed to identify patterns and exploit price differences that exist for fractions of a second.
Economic Analysis & Forecasting
Statistical tools are critical in dissecting and forecasting economic trends and patterns. Their application in economic analysis includes various methodologies, such as:
- Vector Autoregression (VAR) Models – Utilised to understand the dynamic relationship between multiple time series, including key economic indicators like GDP, inflation, and interest rates. These models are pivotal in macroeconomic forecasting and shaping economic policy.
- Bayesian Statistics – Employed in economic modelling to incorporate prior knowledge and handle uncertainty. Especially beneficial in scenarios with limited or noisy data, Bayesian methods enhance the robustness of economic forecasts.
- Econometric Modelling – Involves using statistical techniques to test hypotheses and estimate future trends based on historical economic data. This approach is fundamental in analysing economic relationships and guiding policy decisions.
- Time Series Analysis – Applied to forecast future economic conditions by examining trends, cyclical fluctuations, and seasonal patterns in historical data. Techniques like ARIMA models are commonly used for short-term economic forecasting.
- Structural Equation Modelling (SEM): Used for testing and estimating causal relationships using a combination of statistical data and qualitative causal assumptions. This is particularly useful in understanding the complex interplay between various economic factors.
Application of Statistical Measures in Real-world Scenarios
Here are some examples of applying statistical tools to real-world financial problems:
- A hedge fund wants to test if a short-selling strategy can gain abnormal returns. They set a null (base) hypothesis that their fund returns are, on average, not significantly different to market returns, and the alternative hypothesis is that their strategy returns are greater. Using a t-test, the p-value is 0.02 which is lower than significance level of 0.05, so they reject the null and conclude their strategy does lead to excess returns.
- Just to explain the result in simple English, the ‘0.02’ is saying that the fund’s average returns are in the top 2% of possible market return outcomes. It’s unlikely this is by chance, so we reject the null hypothesis that the fund returns could be the same as a ‘good day in the market’! Or picture it like this:
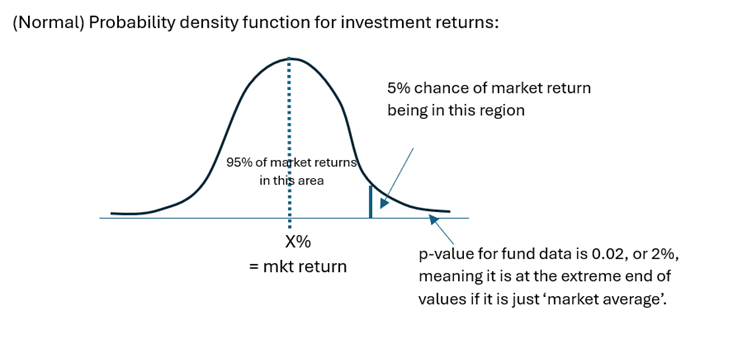
- This use of statistics also shows you their limitations: there is still a 2% chance we end up rejecting the null hypothesis when, in fact, it is true.
- A credit risk analyst builds a multi-factor regression model and does some analysis. Default history for thousands of loans is available. The analyst identifies borrower income, credit score and debt-to-income as independent variables and default status as dependent variable. The regression coefficients help quantify impact of each credit risk factor on probability of default.
- A business analyst uses time series decomposition to forecast business sales. She identifies upward trend and seasonal patterns on a monthly basis. She then builds an ARIMA model factoring in this trend and seasonality component to predict future sales to help with inventory management.
- An actuarial team uses Monte Carlo simulation to estimate value at risk for an insurance portfolio. They model claim amounts as lognormal distribution based on past claims data. Running 10,000 simulations provides an empirical loss distribution from which they derive VaR at 95% confidence level.
Properly applying suitable statistical techniques to financial problems leads to data-driven insights and objective decision making.
An understanding of statistical concepts, along with how they are applied in real-world situations, is an indispensable skill for financ1e professionals working in data analysis, trading, risk management and corporate finance roles in banking and financial services firms.
")