Sensitivity Analysis Explained: Definitions, Formulas and Examples
Sensitivity analysis is an indispensable tool utilized in corporate finance and business analysis to comprehend how the variability in key input variables influences the performance of a business. By methodically adjusting the inputs and observing the ensuing effect on outputs, analysts can discern which variables have the most profound impact on the bottom line. This enables companies to concentrate on managing the most sensitive factors to enhance profitability and mitigate risk.
Article Contents
Key Takeaways
| Key Takeaway | Summary |
| Definition | Measures how the variability in inputs impacts the outputs of a model. |
| Goal | Identify which inputs drive most of the variation in the output. |
| Formula | New Output = Base Output x (1 + Change in Input) |
| Methods | One-at-a-time analysis, differential analysis, scenario analysis, Monte Carlo simulation, tornado diagrams. |
| Advantages | Quantifies risk, guides decisions, explores scenarios, enhances comprehension of key variables. |
| Disadvantages | Time consuming, requires resources, limited to model inputs. |
| Examples | Varying units sold, interest rates, costs, revenues, tax rates, etc. to see impact on profits, NPV, etc. |
What is a Sensitivity Analysis?
A sensitivity analysis measures how susceptible the output of a model is to alterations in the value of the inputs. It aids in identifying which input variables drive most of the variation in the output. For example, in a financial model measuring a company’s profitability, key inputs typically encompass sales growth, cost of goods sold, operating expenses, interest rates, inflation and tax rates. By increasing and decreasing each of these inputs and observing the impact on profits, you can determine which inputs are most sensitive – where minor changes instigate major swings in profits.
Sensitivity Analysis Formula
While there isn’t a single formula for sensitivity analysis, the general approach is to select an input, modify it by a specified amount, and ascertain the impact on the output. Analysts typically vary inputs up and down by a fixed percentage, such as 10%, to assess sensitivity. The simplistic formula is:
New Output = Base Output x (1 + Change in Input)
For instance, if revenue is amplified by 10% from $100 to $110, the formula is:
New Profit = Base Profit x (1 + 10%) = Base Profit x 1.10
Note: This formula represents a straightforward scenario and actual scenarios may exhibit more complex relationships between input changes and output results.
Typically, in reviewing client forecasts as a credit analyst, the “base case” provided by the client will show steady growth in sales and margins. The analyst will typically sensitise this, making a no growth and no margin improvement case, to see if debt ca still be serviced satisfactorily. A separate Combined downside will also typically be modelled where the company is deemed to have experienced difficult trading such as might occur in a recession.
Data services like S&P Capital IQ and FactSet allow analyst to look back and see exactly how variable sales and margins have been in previous recessions. This can provide a very concrete and rational basis for designing a “downside/recession” scenario.
How to do a Sensitivity Analysis in Excel
Excel is a practical tool for conducting sensitivity analysis. Here are the general steps:
- Build a financial model to calculate the baseline output, such as net income.
- Create input variables for the major value drivers, like unit sales, price per unit, variable costs per unit, fixed costs, tax rate, etc.
- Save a copy of the baseline model. Then change one input variable at a time by a fixed amount, like 10%. Recalculate the new output.
- Repeat step 3 for each input variable. Record the new output values each time.
- Compare the range of outputs to determine which inputs had the greatest impact. Produce charts in Excel to visualize the sensitivity analysis.
- Optionally, automate the process using Excel Data Tables.
- More complex inputs can be modelled in Excel using tools like index or choose together with data validation or VBA tools such as combo boxes.
Below, we’ve created an example of a Sensitivity Analysis for an operating income statement, using Excel’s data analysis functions to perform the analysis:
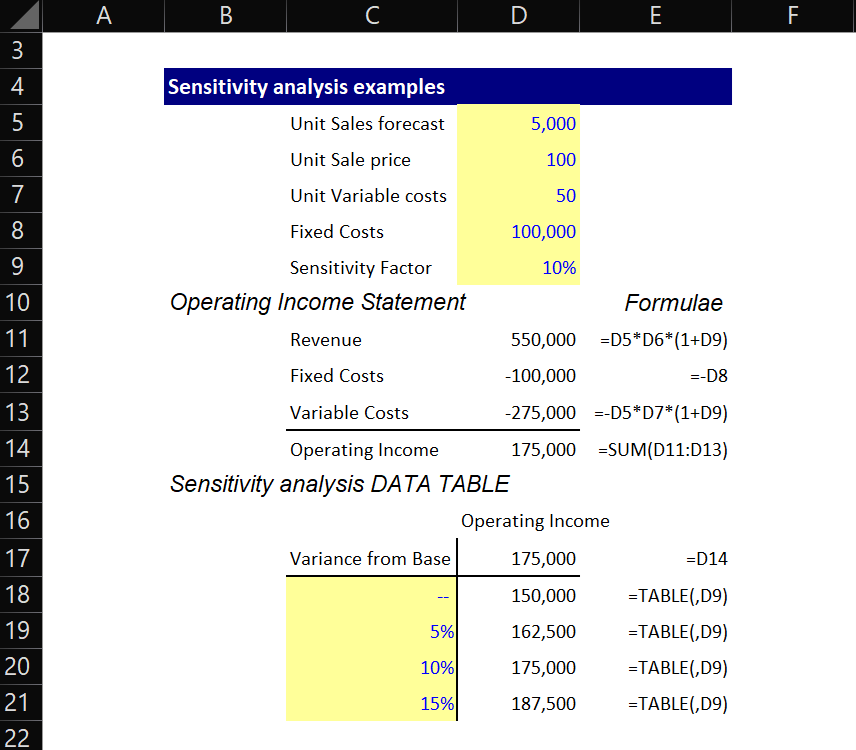
To implement the sensitivity analysis DATA TABLE:
- Input a cell reference for the operating income (=D14) in as the starting value for the table (D17), and your sensitivity variance factors in below (C18 to C21).
- Select your sensitivity factors and operating income column (C17:D21)
- Navigate the Excel menu ribbon to Data, What if analysis, Table, and you will see the following dialog box.
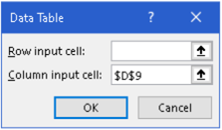
- Input the cell for your initial Sensitivity Factor (D9) into the “Column Input cell box”. Press OK.
Excel will then perform your sensitivity analysis: it will take your sensitivity factors (from C18 to C21) one by one, enter them into your given sensitivity factor (D9) and then return the corresponding result from (D17, the cell at the top of the table). It will output the result into the cell next to the input tested. Try them out individually by typing them one by one into D9 using the initial table.
Sensitivity Analysis Methods
There are several common methods and techniques for performing sensitivity analysis:
- One-at-a-time (OAT) analysis: Alter one input variable while maintaining others constant. This method is straightforward but can miss interactive effects between variables.
- Differential analysis: Calculate the rate of change in output based on minute changes in input, thereby allowing ranking of sensitivity.
- Scenario analysis: Adjust multiple inputs simultaneously to model various scenarios, like worst-case and best-case, which offers a spectrum of possible outcomes.
- Monte Carlo simulation: Utilize repeated random sampling of input variables to generate a probability distribution of potential outcomes. This is especially useful for models incorporating uncertainty.
- Tornado diagrams: Graphically illustrate the sensitivity ranking of inputs. The wider the bar, the larger the impact.
Advantages and Disadvantages of Sensitivity Analysis
Advantages:
- Identifies pivotal value drivers upon which to focus management attention.
- Helps in quantifying the risk in a project or forecast.
- Guides decisions and mitigates risk.
- Explores scenarios and formulates contingency plans.
- Enhances comprehension of the nature of the key success variables.
- Static analysis might overlook dynamic interactions.
Disadvantages:
- Can be time-consuming when testing numerous scenarios.
- Necessitates resources and specialized skills.
- Does not optimize inputs.
- Limited to model inputs, even if the model itself is incomplete or inaccurate.
Exercises and Examples for Sensitivity Analysis
Here are some examples to practice conducting sensitivity analysis:
- A company has fixed costs of $100,000. Unit variable costs are $50, and units sold are projected at 5,000
- Calculate operating income sensitivity to a 5%, 10%, and 15% variation in units sold.
- A loan has a principal of $500,000, an interest rate of 6%, and a term of 10 years. Calculate the sensitivity of total repayments to a 0.5%, 1%, 1.5% change in interest rate.
- An oil company’s net income is based on revenue of $2 million, operating costs of $1.2 million, and a tax rate of 40%. Test sensitivity to 10% changes in revenue, costs, and tax rate.
- For a capital budgeting project with: NPV = -$1250, Investment = $5000, Lifespan = 5 years, and Discount Rate = 15%, determine the sensitivity of NPV to changes in each input.
Sensitivity analysis is a critical financial modelling technique in the sphere of corporate finance. By discerning which inputs have the most substantial impact on outcomes, companies can hone their efforts on the value drivers that matter most. Performing sensitivity analysis leads to better-informed, data-driven decisions, providing a structured approach towards understanding financial variability and risk.

Sensitivity Analysis FAQs

Former banker turned entrepreneur. I successfully restructured, purchased, managed and sold a private engineering group, Steel Line Ltd, through an LBO and was also an equity partner in Corporate Training Group which my partners and I successfully sold to the AIM listed ILX group in 2006. I established Capital City Training Limited in early 2010 with my business partner Greg. We acquired MS Consultants a few years ago (so I’m still doing a bit of M&A). I have had non-exec roles for a small and growing VA/recruitment business and a fast-growing beverage logistics company. I am also an active investor.
Capital City Training is a full service technical and management development training company focused on the banking, wealth management and broader financial services and accounting industries. Having said all that, in the last couple of years we’ve been branching out into training for non-financial companies – manufacturing, retail, tech, defense.. so old and new economy. We also provide consultancy around modelling and are currently working for a leading PPP/PFI advisory firm. We have delivered training in every continent of the world in 2024… except Antarctica. Perhaps in 2025?! Watch this space.
Capital’s dedicated faculty combine extensive line experience as corporate financiers, bankers, traders, portfolio managers and equity analysts together with over 60 years of experience in learning and development as both procurers and providers of tailored in-house training, eLearning and blended learning. Our faculty also includes experienced Management development training specialists allowing us to provide HR consultancy services, management development training and also innovative integrated management development & technical training events. Capital City’s faculty embody over 100 years of line experience across the fields of accounting, corporate finance, derivatives, credit, lending, investment, equity research transaction banking and origination.