What is Compound Annual Growth Rate?
Compound annual growth rate (CAGR) is a useful metric for presenting a variable growth trend by its implied weighted-average compound growth rate over a period of time: It smooths out volatility in growth and accounts for the compounding effect from year to year.
CAGR represents the constant compound rate at which an investment would have grown if it grew at a steady rate each year rather than actual varying amounts from year to year. For example, if a stock is worth $10 today and is worth $16 in 5 years, the CAGR is the annual growth rate that gets you from $10 to $16 over 5 years assuming the growth was smooth each year.
The key benefit of CAGR is that it gives you an easy way to compare growth rates from varying time periods. While a simple annual growth rate will fluctuate based on performance each year, CAGR lets you measure consistent growth over time, regardless of volatility.
CAGR is an important metric in financial modelling, analysis, and valuations. It provides a normalized growth metric that corporate finance professionals use for everything from evaluating investment returns to projecting future growth rates.
Article Contents
Key Takeaways
| Aspect | Takeaway |
|---|---|
| Definition of CAGR | CAGR measures a variable growth trend by its implied weighted-average compound growth rate over a period, smoothing out volatility and accounting for compounding effects year to year. It represents the constant compound rate at which an investment would have grown assuming steady growth each year. |
| Calculation Formula | CAGR is calculated as (End Value / Start Value) ^ (1 / Number of Years) – 1, where ‘End Value’ is the final value after growth, ‘Start Value’ is the initial value before growth, and ‘Number of Years’ is the period over which growth is measured. |
| Calculation in Excel | Excel’s RATE function and a combination of POWER and LN functions can be used to calculate CAGR, simplifying the process, especially for large data sets and longer time periods. |
| Comparison with SAGR | CAGR smooths out volatility and assumes steady growth over a period, while Simple Annual Growth Rate (SAGR) reflects actual yearly fluctuations without smoothing. CAGR is more effective for long-term growth analysis and trend indication. |
| Other Relevant Metrics | Metrics like Average Annual Return (AAR), Geometric Mean Return, Risk-Adjusted Performance Measures, and Total Shareholder Return (TSR) are also important for a comprehensive financial analysis alongside CAGR. |
| Limitations of CAGR | CAGR has limitations such as smoothing volatility, not accounting for dividends, sensitivity to start and end dates, ignoring additional equity, and not factoring in investment risk or volatility. |
CAGR Formula
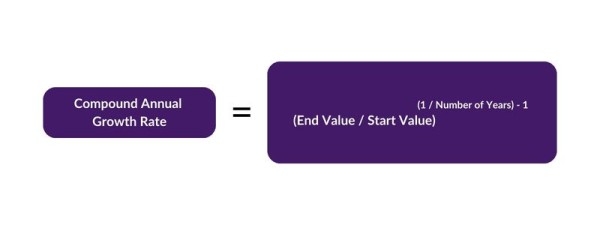
The compound annual growth rate is calculated using the following basic formula:
CAGR = (End Value / Start Value) ^ (1 / Number of Years) – 1
Where:
- End Value = The final value after the period of growth
- Start Value = The initial value before the period of growth
- Number of Years = The number of years over which growth is measured
To calculate CAGR, you take the nth root of the total return, where n is the number of years. This normalizes the growth rate as if it compounded at a steady rate annually.
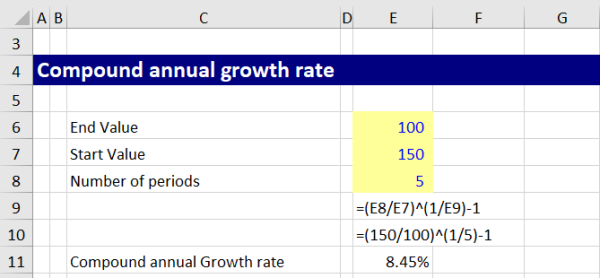
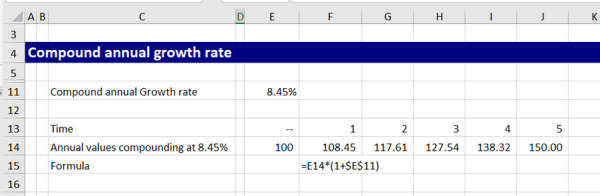
For example, if you invest $100 and it grows to $150 over 5 years, the CAGR would be:
CAGR = (150/100) ^ (1/5) – 1 = 0.08455 or 8.45%
How to Calculate CAGR in Excel
While the CAGR formula can be calculated manually, Excel provides some useful functions to make it easier to find the compound annual growth rate of an investment.
The simplest way is to use the RATE function in Excel. The RATE function takes the start and end values plus the number of periods as inputs and calculates the steady growth rate per period.
For example, to calculate the CAGR of an investment that grew from $100 to $150 over 5 years, you could use the formula:
=RATE(5,,-100,150)
This returns 0.085 or 8.5%. The pv is entered as a negative number to indicate a cash outflow by the investor.
Additionally, Excel’s POWER and LN functions can be combined to apply the CAGR formula directly:
=POWER(150/100, 1/5) – 1
This calculates the 5th root of 150/100 and subtracts 1 to return 8.5% CAGR.
Using Excel to calculate CAGR is faster and easier than doing it manually, especially for larger data sets and time periods. Excel’s built-in financial functions streamline the process.
CAGR vs. Simple Annual Growth Rate
While both measure growth over time, there are key differences between compound annual growth rate (CAGR) and simple annual growth rate (SAGR):
- Basis of calculation: CAGR smooths out volatility by taking the nth root of total growth, while SAGR just measures year-over-year growth without smoothing.
- Growth assumptions: CAGR assumes steady growth each period, whereas SAGR shows actual fluctuating growth rates each year.
- Time periods: CAGR can measure growth over any number of years. SAGR is best for a 1-year period before compounding skews results.
- Use cases: CAGR is better for long-term growth analysis and projections. SAGR reveals specifics of year-over-year changes.
- Volatility: CAGR ignores volatility or ups and downs by smoothing growth. SAGR reflects peaks and valleys of performance.
- Trend analysis: CAGR better indicates long-term growth trends it is the effective compound growth rate achieved to the horizon. SAGR overstates returns. We can see this if we consider an investment of 100 falls 50%, halving to 50 in the first year and then goes back up by 100%, doubling to 100. The overall return is zero but the Simple average growth rate is SAGR = (-50%+100)/2 = 25%! Clearly this doesn’t give us a good picture of returns.
In summary, CAGR doesn’t tell us about variability of return but instead about the effective compound rate of return. This makes investment performance readily comparable across different products and funds. It is better for long-term financial analysis. SAGR shows effective annual fluctuations rather than a steady growth approximation.
Comparing CAGR with Other Metrics
While CAGR is a valuable metric for understanding the smoothed average growth rate over a period, it’s essential to consider other financial metrics to get a complete picture:
Average Annual Return (AAR)
This metric provides the arithmetic mean of a series of yearly returns. Unlike CAGR, which smooths the rate over the period, AAR highlights year-to-year fluctuations. AAR can sometimes provide a more optimistic view than CAGR, especially if there are a few years of extraordinarily high returns.
Geometric Mean Return
Often used for portfolios with multiple investments, the geometric mean return is the average rate of return of an investment, which is deemed reinvested, and it can be different than the arithmetic average return. It gives a more accurate depiction of performance, especially for volatile investments.
Risk-Adjusted Performance Measures
These metrics, like the Sharpe Ratio and Sortino Ratio, incorporate both the return and risk associated with an investment. A higher Sharpe or Sortino Ratio indicates better risk-adjusted performance. While CAGR gives a good understanding of growth, these ratios help determine if the returns are worthy compared to the risks taken.
Total Shareholder Return (TSR)
TSR represents the total return of a stock to an investor, including capital appreciation and dividends. When assessing a stock’s performance, CAGR might only capture the capital appreciation aspect, while TSR gives a fuller picture by including dividends, which might be a significant component of a stock’s return.
Incorporating multiple metrics ensures a well-rounded analysis, enabling analysts and investors to understand not just growth, but the quality and risks associated with that growth.
Limitations of CAGR
While useful, CAGR does have some limitations to consider:
- Smooths volatility – By assuming steady growth, CAGR masks peaks and valleys in performance. It should not be used alone to evaluate investment options.
- No accounting for dividends – The CAGR calculation does not include dividend reinvestment. It purely measures capital appreciation.
- Point-to-point sensitivity – CAGR between two points can vary significantly depending on start and end date.
- Ignores additional equity – CAGR fails to consider share issuance that alters share count used to calculate growth.
- Time period constraints – CAGR accuracy suffers with very long or very short time periods.
- Retrospective view – CAGR calculates historical growth. It does not predict changes in future growth trajectories.
- Risk Oversights – While CAGR offers a smoothed annual return perspective, it doesn’t factor in the investment’s risk or volatility. Investments with higher CAGRs might be riskier than others with slightly lower CAGRs.
In summary, while a useful normalized growth metric, CAGR should not be used in isolation. It is best supplemented with other metrics like total shareholder return (TSR) to account for limitations.
CAGR Case Studies
Case Study 1 – Analysing Historical Growth
A financial analyst is evaluating two e-commerce companies – Company A and Company B. He wants to compare their historical revenue growth over the past 5 years.
Company A has grown total revenue from $50 million to $90 million over the 5-year period.
Company B increased revenues from $60 million to $100 million. Using CAGR, the analyst can calculate and compare the steady historical growth rates.
Company A CAGR = (90/50)^(1/5) – 1 = 12.47%
Company B CAGR = (100/60)^(1/5) – 1 = 10.76%
Based on CAGR, Company A has demonstrated faster historical revenue growth at 12.5% vs 10.76% for Company A. The analyst has a normalized growth metric to analyse.
Case Study 2 – Projecting Future Growth
A portfolio manager wants to project future revenue for a SaaS company she is evaluating for investment. The company has grown revenue at a CAGR of 20% over the past 5 years. Current annual recurring revenue is $50 million.
The portfolio manager uses the historical CAGR to predict future ARR. Assuming revenue continues growing at 20% CAGR, she projects the company will reach $124.4 million in ARR after another 5 years:
Projected ARR = $50 million x (1.20)^5 = $124.4 million
This revenue projection can inform her analysis of the company’s valuation and allows comparison to other SaaS firms’ growth trajectories. The historical CAGR provides an estimate of future growth.
Why CAGR is Important in Corporate Finance
Compound annual growth rate is a vital metric used extensively in corporate finance. Here are some reasons why CAGR is so important:
- Evaluating investment returns – CAGR provides a normalized return metric that smooths out volatility. This allows for apples-to-apples comparison of investments with varying periods of growth.
- Projecting future growth rates – Financial analysts often use historical CAGR as a starting point for estimating future growth trajectories, especially in valuation models and discounted cash flow projections.
- Comparing company performance – Within an industry, CAGR allows comparison of revenue or earnings growth between competitors. It measures consistent growth rather than one-time gains.
- Analysing trends – CAGR can reveal accelerating or slowing growth trends. This may signal needed changes in strategy to align with growth patterns.
- Estimating terminal value – In DCF analysis, terminal value depends heavily on the projected CAGR, so accurate growth rate estimates are critical.
- Corporate valuation – CAGR is a key input in ROI analysis and valuation models like comparables. The growth assumption impacts the valuation.
- Performance measurement – Corporations may include CAGR in executive compensation metrics to incentivize steady growth.
In summary, CAGR is indispensable for corporate finance roles because it isolates steady growth over time, ignoring short-term fluctuations. This provides key insights for analysis, modelling, valuation, and strategy.
To learn more about Compound Annual Growth Rates and other financial metrics, take our Financial Maths Bootcamp course.
