What is EV/EBITDA? Concepts, Formula and Examples
EV/EBITDA is an important financial ratio used in corporate finance and valuation analysis. It stands for Enterprise Value divided by Earnings Before Interest, Taxes, Depreciation and Amortization. EV/EBITDA is a popular valuation multiple used to compare companies within the same industry and measure their relative valuation.
Article Contents
- What is ‘basic’ EV/EBITDA?
- Understanding the Complexities of EV/EBITDA
- Why is Enterprise Value not so simple?
- The FULL EV/EBITDA formula
- Using Total Enterprise Value
- How to Calculate EV/EBITDA in Excel
- Significance of EV/EBITDA
- Industry Benchmarking with EV/EBITDA
- Limitations and Pitfalls of EV/EBITDA
- Comparison with Other Valuation Metrics
- Practical Applications and Examples of EV/EBITDA
- EV/EBITDA in Financial Modelling
Key Takeaways
| Key Takeaway | Summary |
| What is EV/EBITDA? | A valuation multiple that measures a company’s enterprise value relative to its earnings (EBITDA). Useful for comparing companies and valuation. |
| Formula | EV/EBITDA = (Market Capitalization + Debt – Cash) / EBITDA Be careful as there may be other claims and assets which make this basic formulation inaccurate |
| Why Useful? | Neutralizes effects of capital structure and debt; Removes accounting distortions; Facilitates comparison between peers; Cash flow proxy. |
| Compare to Industry | EV/EBITDA varies significantly by industry based on growth outlooks and capital intensity. Allows benchmarking relative to peers. |
| Limitations | Not meaningful for negative EBITDA; Doesn’t account for capital expenditure differences between companies. EBITDA is capable of being manipulated by management |
| vs. P/E Ratio | EV/EBITDA offers broader view of company value inclusive of debt. Useful when comparing across industries or different capital structures. |

What is ‘basic’ EV/EBITDA?
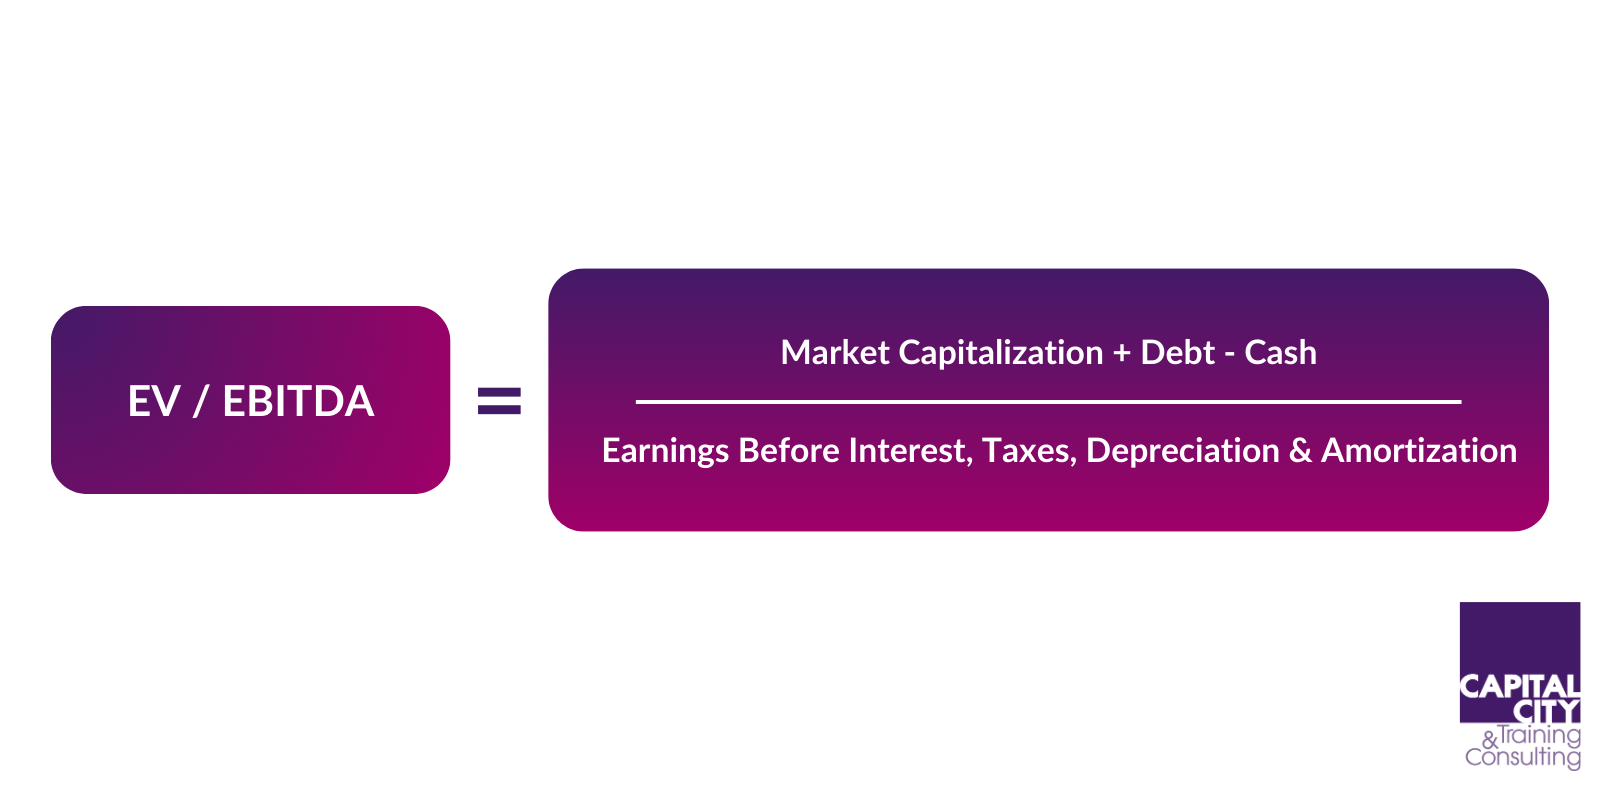
EV/EBITDA is a valuation multiple that measures the value of a company relative to its earnings. Enterprise Value (EV) refers to the total value of a firm and is calculated as Market Capitalization plus Debt minus Cash. EBITDA stands for Earnings Before Interest, Taxes, Depreciation and Amortization.
The formula to calculate EV/EBITDA is:
EV/EBITDA = Enterprise Value / EBITDA
Where:
- Enterprise Value = Market Capitalization + Debt – Cash
- EBITDA = Earnings Before Interest, Taxes, Depreciation & Amortization
For example, if a company has:
- Market Capitalization = $100 million
- Total Debt = $20 million
- Cash = $10 million
- EBITDA = $20 million
Then its Enterprise Value is:
- EV = Market Cap + Debt – Cash
- = $100 million + $20 million – $10 million
- = $110 million
And its EV/EBITDA is:
- EV/EBITDA = Enterprise Value / EBITDA
- = $110 million / $20 million
- = 5.5x
So, this company has an EV/EBITDA multiple of 5.5x. This means the company’s enterprise value is 5.5 times its EBITDA.
Understanding the Complexities of EV/EBITDA
A Price earnings Ratio is straightforward. Owning a share makes you the owner of a share of earnings after interest and tax. Earnings are what generate dividends. It makes sense to think of the cheapness or expensiveness of a share using a P/E. A high price to earnings is expensive Low is cheap.
If I want to value a whole business, on a “cash free debt free basis” – this is how the newspapers describe it – then a P/E isn’t much help.
Let’s suppose that you have done a valuation of a business by discounting its operating cashflow or taken a multiple of its EBITDA. You come up with the value of £100m. This then begs the question, what have we valued?
The simple answer is you have valued the net operating assets of the business – i.e. the net assets that generate the operating profit (EBITDA) or pre-financing operating cashflow that you have discounted.
You will need to buy the company’s fixed assets (both tangible – machines and factories – and intangible – brands, patents etc.), and you will need to make a permanent investment in working capital – raw materials, work in progress, finished goods and receivables but partly financed by free short terms loans – accounts payable from suppliers. Notice, we don’t need to buy the cash: the interest on cash is not included in the cashflow you have discounted or in the EBITDA that you’ve applied a multiple to.
In other words, you need to buy the company’s fixed assets and working capital.
When you acquire a company, you can broadly do it in two ways: you can do a share purchase – you buy the company. Or you can buy the company’s assets – you agree a list of what you are buying, down to the last table and chair! We may also agree to take on liabilities – like the trade payables.
The obvious question now is why would I do something complicated like an asset purchase instead of buying shares? Well, a company may have two businesses, but it only wants to sell one. The two businesses aren’t separately incorporated, maybe I’m a farmer and I’m selling off my successful farm shop. There are no shares or “Farmshop Ltd.” We have to do the asset sale route.
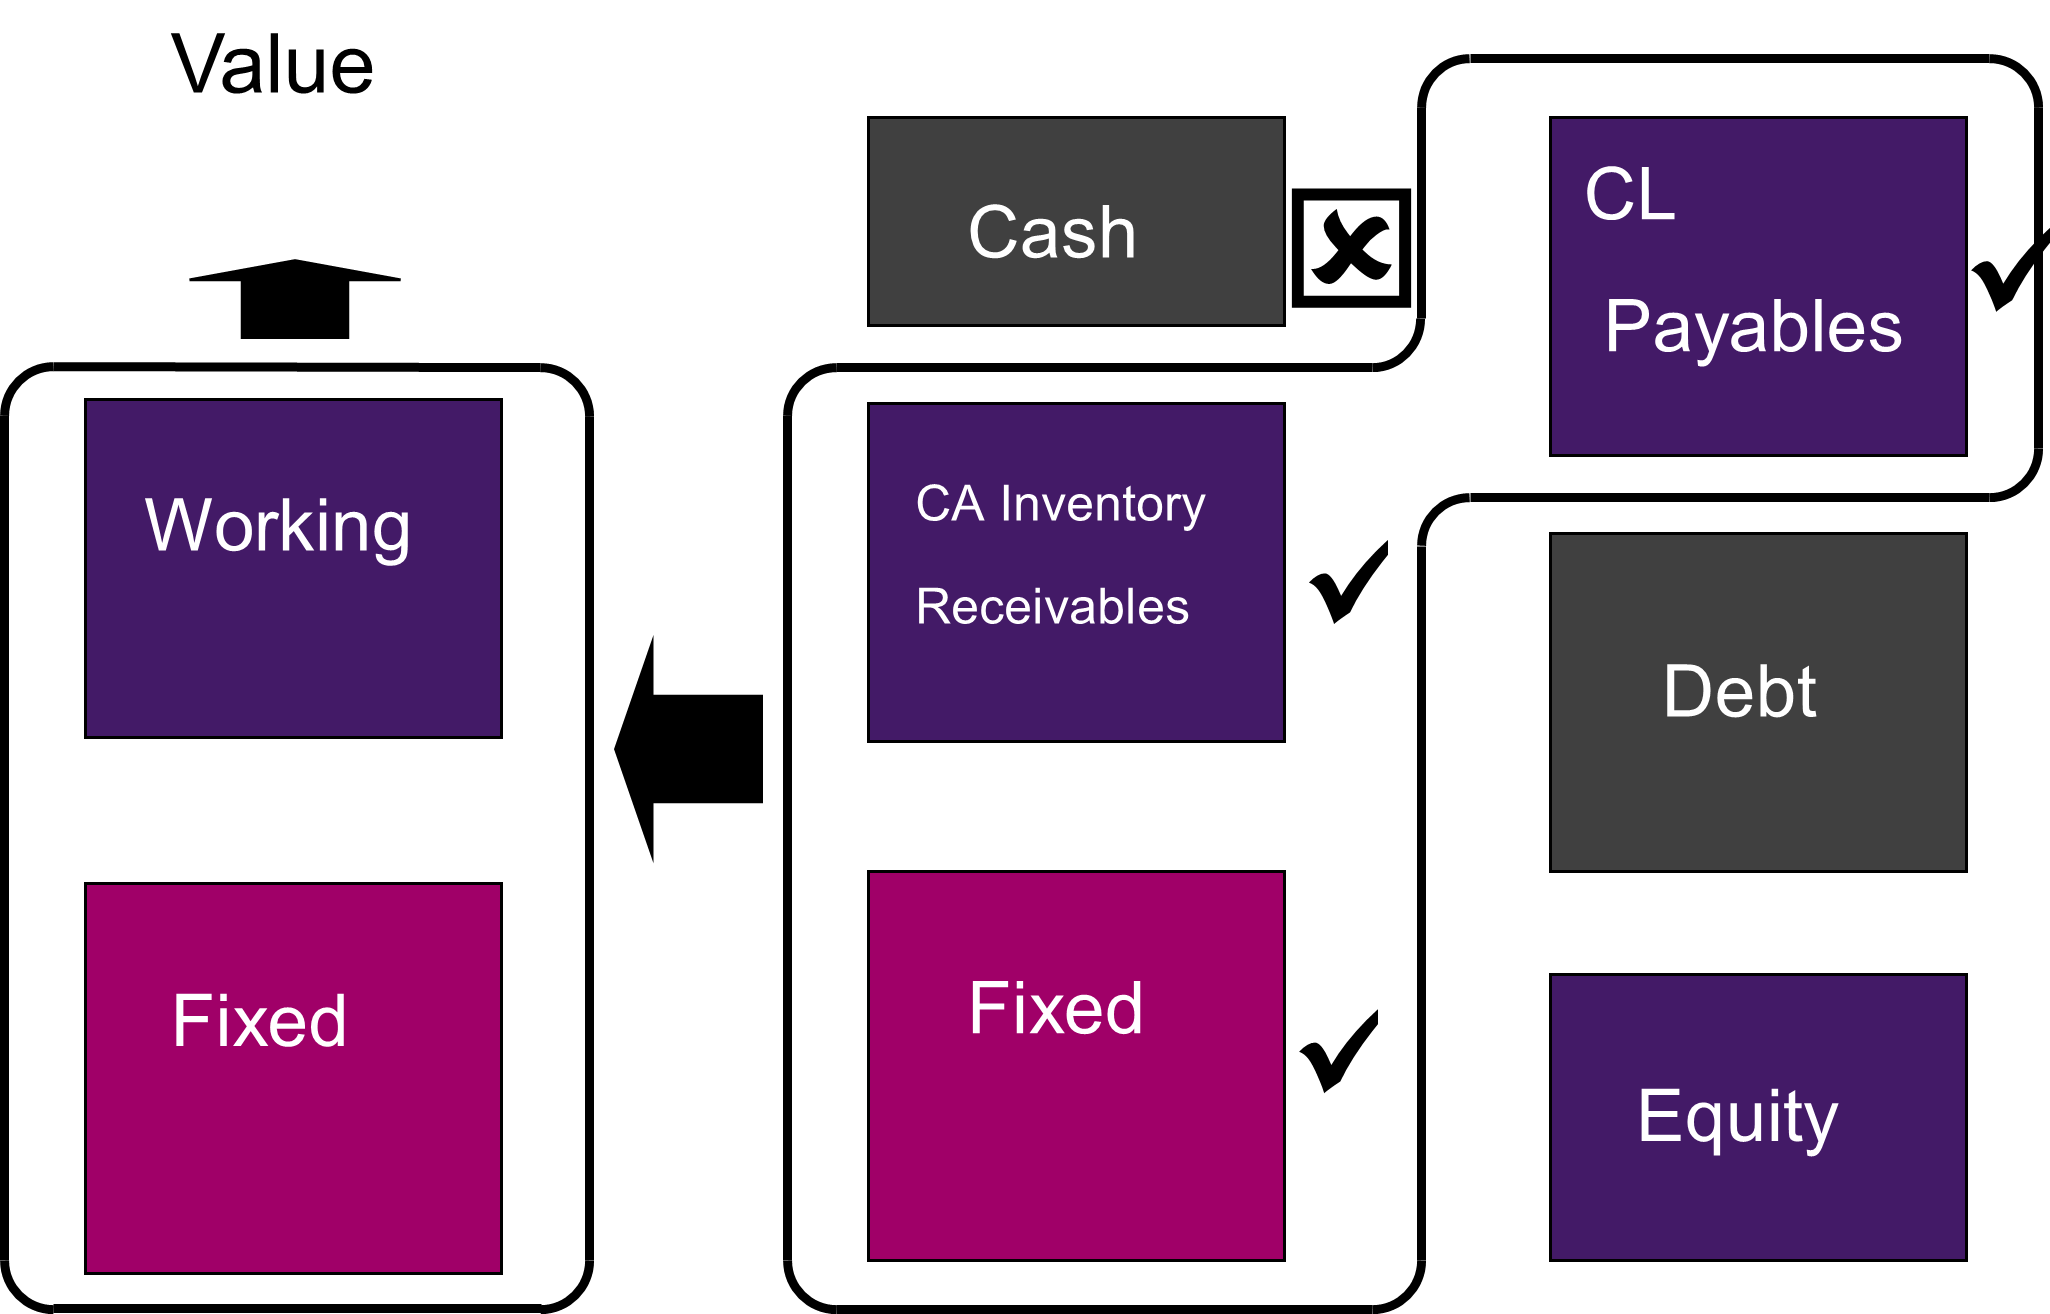
Enterprise Value is the fair value of these net operating assets in the box. What you would need to buy in a net asset purchase to own the money-making machine that you think is worth £100m.
What is a fair price to pay for just the equity in a share purchase? If we want to own the net operating assets, it’s not enough to just buy the shares, as the banks would still be owed their debt.
To own the operations outright, we would have to buy the debt as well. If we do this though, we won’t just own the operations, but we get a bonus, also we’ll own the cash on the balance sheet.
In this scenario, we see that:
Value of Operations + Cash = Fair Value of Debt and Equity
If we rearrange:
Value of Operations = £100m = Value of Equity + (Debt-Cash) = Enterprise Value
The title enterprise value is exactly what it says it is – the value of the enterprise, or the business. What we have just done is what is called the Enterprise value to equity bridge. How do you get to one from the other.
Another way to think about this is to think of a house that you have a mortgage on. The house has a valuation. The size of the mortgage just tells you how much of the value belongs to the banks and how much (what’s left) belongs to you.
Why is Enterprise Value not so simple?
The example of the farm and shop is a good one. Many companies aren’t as simple as our chart. A real conglomerate balance sheet may look more like this:
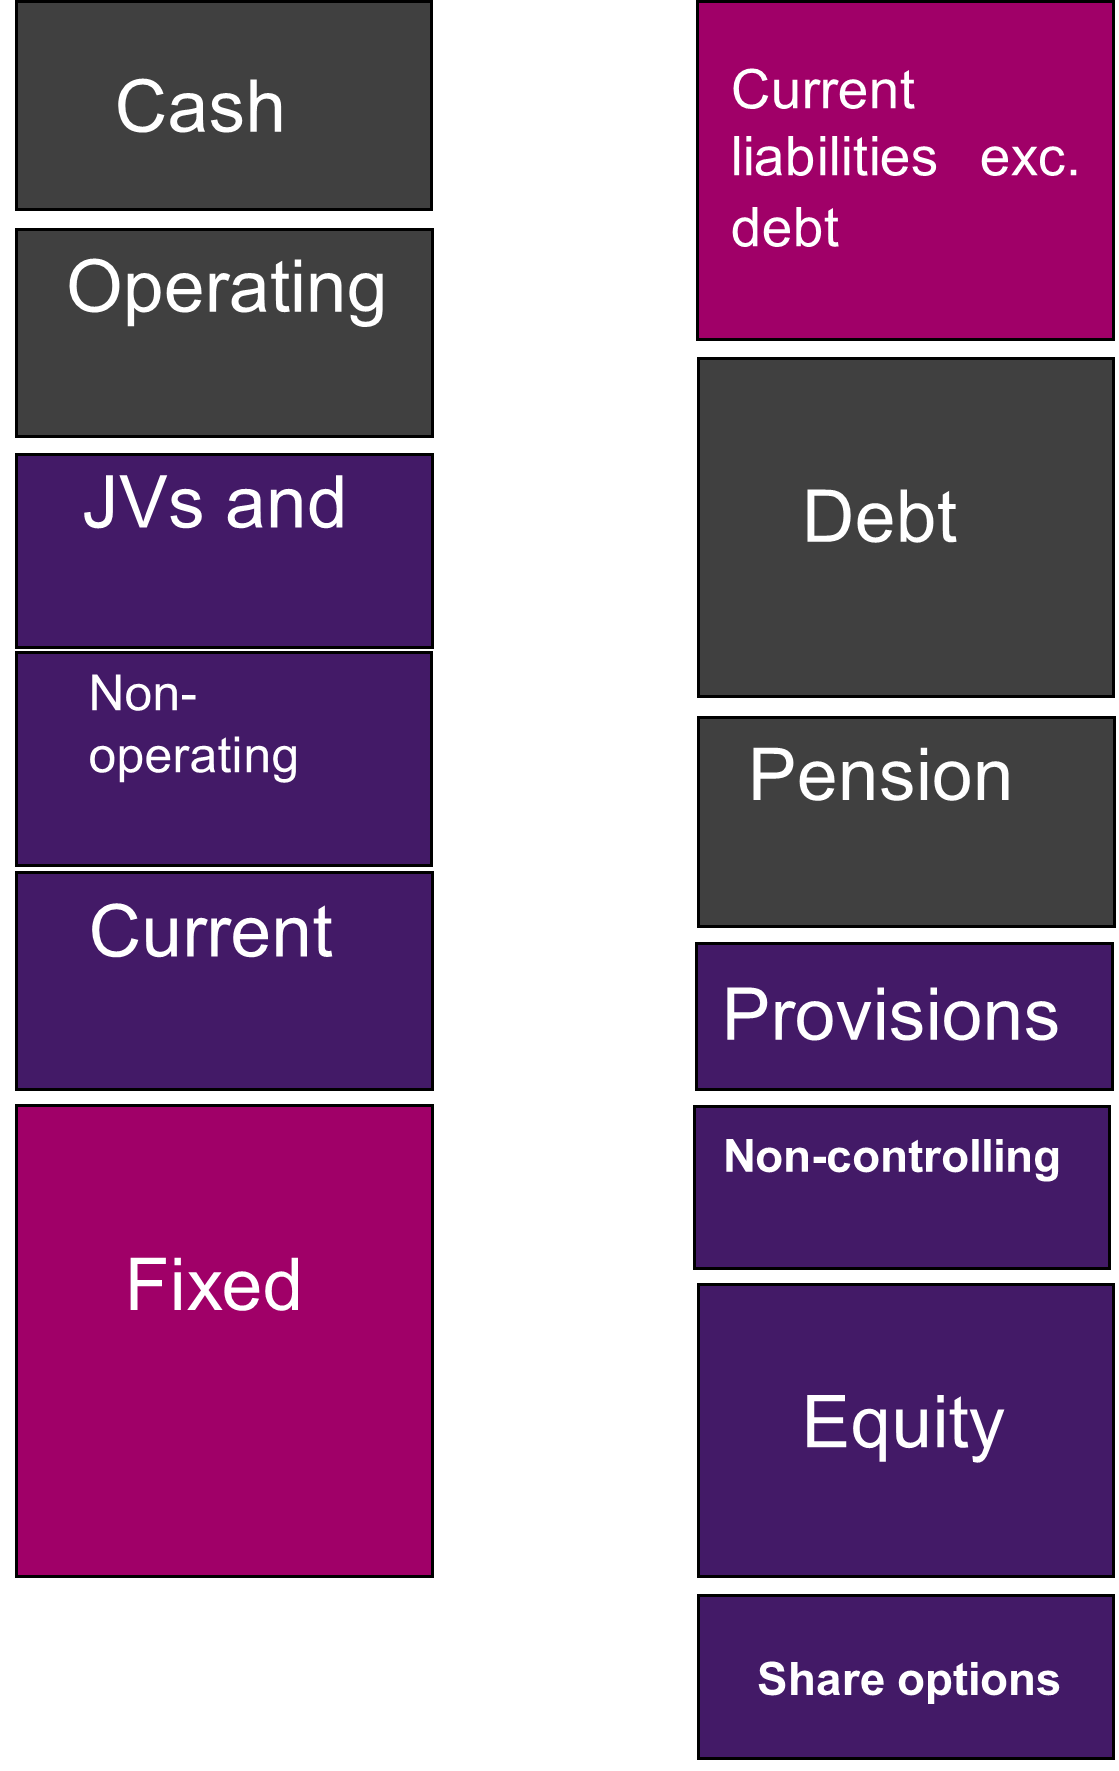
As well as owning the core operations the company may also have Joint ventures and associate investments and non-operating assets.
Secondly the company may have other equity securities and liabilities:
- Pension liabilities
- Provisions
- Preference shares
- Non-controlling interests
- Share options
The FULL EV/EBITDA formula
The formula for Enterprise Value should then look like this:
Enterprise value + JVs and associates + non-operating assets = Common Equity + Non-Controlling Interests + Preference shares + Pension deficit+ Provisions + Share Options Buyout
Using Total Enterprise Value
The shortcut that platforms like S&P CapIQ take is to use the idea of Total Enterprise Value or TEV. EBITDA is defined as including JV income and share of associates. TEV is the value not just of the core operations but also the JVs and associates.
This is a problem for us as analysts as what we get is an average multiple. You typically would value a share of JV or associate earnings on a very different multiple to the EBITDA mu ltiple for core operations. In Total EBITDA we are adding together EBITDA from the core with shares of net profit after tax from assocs. And JVs. This compromise is understandable, otherwise, the platforms would have to suggest valuations of JVs, associate and non-controlling interests to give a “clean” EV/EBITDA.
This isn’t a trivial issue: Potential bidders for Fosters, the Australian brewing group were put off because of the uncertainty over the valuation of Fosters’ very substantial wine business. Fosters sold the wine business to Constellation Brands and within 9-months was the subject of a successful bid from SABMiller.
The issue of non-operating assets is also very important: when the UK post office was privatised, a big “hidden” part of its value was its property portfolio. Lots of valuable post offices could be sold off and repurposed and the same services provided from smaller premises or from less valuable locations – in the case of sorting offices.
In the French supermarket company Casino Guichard, it was very difficult to value its equity because of the very large non-controlling interests at its operating subsidiaries. If we want to value the parent company’s stake, we have to value the individual subsidiaries, value the stakes of the minority shareholders and then do a sum-of the-parts valuation. A basic EV/EBITDA multiple will give us a very simplistic and potentially wrong picture.
Provisions and pension liabilities also need to be analysed, and in most cases, treated as debt. A pension provision is the present value of expected future payments to pensioners. It’s very debt like – If a company goes insolvent in the UK, the pension trustees rank alongside the banks. Operating provisions are expected or planned future costs which have been recognised in the P+L for restructuring, legal bills and the like. They just haven’t been paid yet. They are like Short-term debt.
All of these complexities mean that in a complex or troubled business, an EV/EBITDA multiple – without adjustment for other liabilities and equity claims – can give only a superficial view of valuation.
In short, we should take care when taking these multiple at face value unless we clearly understand a company’s corporate structure.
Having said all of the above, EV/EBITDA is useful for valuing and comparing companies for several reasons:
- Eliminates Effects of Capital Structure: By using enterprise value rather than just market cap, EV/EBITDA neutralizes the effects of capital structure and debt financing. This allows for comparison between companies with different debt levels.
- Comparability: EV/EBITDA allows useful comparison between companies in the same industry.
- Company not equity value: EV/EBITDA provides a valuation for a whole business, like the valuation of a house.
How to Calculate EV/EBITDA in Excel
EV/EBITDA is easy to calculate in Excel using the following steps:
- Get the market capitalization by multiplying the current stock price by the number of shares outstanding.
- Add the total debt amount to the market capitalization.
- Subtract cash and cash equivalents from the result above to get enterprise value.
- Get EBITDA either from the income statement or calculated separately.
- Divide enterprise value by EBITDA to get the EV/EBITDA multiple.
When comparing valuation, we must make sure the time periods for market cap, debt, cash and EBITDA are the same, such as the last 12 months.
The simple EV/EBITDA formula in Excel is:
= (Market Cap + Debt – Cash) / EBITDA
Always look in detail at the accounts to see if there are material JV’s and associates or other equity claims or liabilities like pensions, operating provisions and non-controlling interests.
Significance of EV/EBITDA
EV/EBITDA multiples indicate the valuation and growth prospects of a company. We must be very careful about trying to compare multiples across different industries. EBITDA is a “shorthand” for a cash operating profit. What generates value is free operating cashflow – after capital expenditure and tax. Much lower EBITDA multiples are relevant for highly capital-intensive industries. This is one reason why, superficially, technology stocks can look very expensive. Their high multiple may just reflect the fact that almost all EBITDA turns into free operating cashflow:
- Higher EV/EBITDA: The company is overvalued or has high growth expected in EBITDA and or low capital intensity.
- Lower EV/EBITDA: The company is undervalued and/or has low growth expected or high capital intensity.
- Negative EV/EBITDA: The company’s enterprise value is negative, or its EBITDA is negative, indicating very low valuation. This can happen in early-stage tech companies where they have raised a lot of cash but have large operating and net losses (after D&A) and where investors have lost confidence.
- Enterprise value = Equity + Debt (which is Zero) less cash. So a company has 50p of net cash per share, but the shares trade at 20p! So “EV” is negative. The market is saying that the company will continue to burn its cash, so the cash on the company’s balance sheet is not worth 100p/£. The cash and value will be destroyed (unless someone buys the company and stops the cash burning).
Industry Benchmarking with EV/EBITDA
Since EV/EBITDA allows comparison between companies, it can be used to benchmark a company against industry peers. The EV/EBITDA ratio varies significantly across different industries, reflecting the diverse nature of business operations and market expectations and free cashflow generation.
For instance, technology companies often exhibit higher EV/EBITDA multiples, which can be attributed to strong growth prospects and a high degree of market optimism about future earnings and low capital intensity. In contrast, utilities and industrial companies typically have lower multiples, reflecting their stable but slower growth trajectories and high capital intensity.
Consider the following hypothetical industry comparisons:
- Technology Firm: With a market capitalization of $500 million, debt of $100 million, cash of $50 million, and an EBITDA of $45 million, the EV/EBITDA multiple would be approximately 12.2x. This higher multiple is indicative of expected rapid growth and significant future earnings.
- Utility Company: A utility company with a market cap of $300 million, debt of $150 million, cash of $30 million, and an EBITDA of $60 million would have an EV/EBITDA multiple of around 7.0x. This lower multiple reflects the industry’s stable cash flows, high cap ex and lower growth rates.
By understanding these industry-specific nuances, investors and analysts can better evaluate a company’s valuation in the context of its sector.
Limitations and Pitfalls of EV/EBITDA
While EV/EBITDA is a widely used valuation metric, it has its limitations. One significant drawback is its inapplicability to companies with negative EBITDA, as this would result in a meaningless or negative multiple. Additionally, it may not be the best metric for capital-intensive industries where depreciation and capital expenditures are significant factors in company valuation.
The simple formulation is too simplistic in lots of businesses. We must always consider other assets on the balance sheet, debt -like liabilities and other equity interests in coming to a valuation. Doing a sum of the parts and separately valuing NCIs and associates and JVs will give a potentially much better insight into valuation in a complex group.
EV/EBITDA does not account for differences in capital expenditure requirements. Two companies with the same EV/EBITDA multiple could have vastly different needs for future capital investments, impacting their actual cash flows and financial health. Hence, this ratio should be used in conjunction with other financial metrics and a thorough understanding of the company’s industry and specific circumstances.
Comparison with Other Valuation Metrics
EV/EBITDA provides a useful perspective on valuation, but it’s informative to compare it with other metrics, such as the Price-to-Earnings (P/E) ratio and discounted cashflow methods. The P/E ratio, calculated as market value per share divided by earnings per share, is more focused on the bottom-line profit. It’s more appropriate for portfolio investors, rather than corporate financiers.
In contrast, EV/EBITDA offers a focused view of a business’ value. Like the value of a house, as opposed to your share after settling your mortgage. It’s particularly useful for comparing companies within an industry but with different capital structures. For instance, a company with a high P/E ratio but a moderate EV/EBITDA might be a subject of interest, indicating strong earnings potential that is not overly inflated by debt levels.
Practical Applications and Examples of EV/EBITDA
There are several applications of EV/EBITDA in valuation and financial modelling:
- Compare valuations in merger and acquisition For example, comparing EV/EBITDA multiples of acquirer and target.
- Value equity stakes in private company investments based on peers’ EV/EBITDA.
- Determine price to earnings (P/E) ratios based on comparable companies’ EV/EBITDA multiples.
- Assess valuation scenarios through multiple expansion/contraction of EV/EBITDA in DCF models.
- Benchmark current and historical valuation of a company against itself and peers.
For example, if a company has an EV/EBITDA of 8x, while similar public firms are at 10x, it may indicate the company is undervalued versus its competitors.
EV/EBITDA in Financial Modelling
In financial modelling, EV/EBITDA multiples can be used to value companies in discounted cash flow (DCF) models. The key steps are:
- Project future prefinancing post tax operating cashflow for the forecast period, based on revenue and earnings assumptions.
- Estimate a continuation/terminal value at the end of projections, using a perpetual growth rate or a terminal EV/EBITDA multiple.
- Discount projected cash flows and terminal value to present value using the weighted average cost of capital (WACC).
- Calculate implied enterprise value and then equity value by subtracting net debt, provisions pensions and other equity claims.
- Determine target stock price based on equity value and shares outstanding.
The terminal EV/EBITDA multiple can be benchmarked to industry averages to arrive at an appropriate perpetuity growth rate and valuation. Sensitivity analysis can be done on the terminal multiple to evaluate various valuation scenarios.
In summary, EV/EBITDA is a widely used valuation metric that allows comparison between companies. It provides a reliable measure of valuation relative to earnings while removing distortions from capital structure, taxes and depreciation. EV/EBITDA serves as a useful tool for financial analysts and managers for valuation, modelling, industry benchmarking and assessing investment opportunities.

EV/EBITDA FAQs

Former banker turned entrepreneur. I successfully restructured, purchased, managed and sold a private engineering group, Steel Line Ltd, through an LBO and was also an equity partner in Corporate Training Group which my partners and I successfully sold to the AIM listed ILX group in 2006. I established Capital City Training Limited in early 2010 with my business partner Greg. We acquired MS Consultants a few years ago (so I’m still doing a bit of M&A). I have had non-exec roles for a small and growing VA/recruitment business and a fast-growing beverage logistics company. I am also an active investor.
Capital City Training is a full service technical and management development training company focused on the banking, wealth management and broader financial services and accounting industries. Having said all that, in the last couple of years we’ve been branching out into training for non-financial companies – manufacturing, retail, tech, defense.. so old and new economy. We also provide consultancy around modelling and are currently working for a leading PPP/PFI advisory firm. We have delivered training in every continent of the world in 2024… except Antarctica. Perhaps in 2025?! Watch this space.
Capital’s dedicated faculty combine extensive line experience as corporate financiers, bankers, traders, portfolio managers and equity analysts together with over 60 years of experience in learning and development as both procurers and providers of tailored in-house training, eLearning and blended learning. Our faculty also includes experienced Management development training specialists allowing us to provide HR consultancy services, management development training and also innovative integrated management development & technical training events. Capital City’s faculty embody over 100 years of line experience across the fields of accounting, corporate finance, derivatives, credit, lending, investment, equity research transaction banking and origination.