Variable costs represent a critical component of financial analysis and business decision making. By understanding how to calculate and analyse variable costs, companies can properly budget, price products and services competitively, and comprehend their cost structure.
What is a Variable Cost?
A Variable Cost is a corporate expense that changes in proportion with activity – i.e., production levels or sales volume. The opposite of that would be a Fixed Cost – one that doesn’t directly change with production or sales: such as rent, insurance, utilities. Some examples of common variable costs are:
- Raw materials
- Packaging costs
- Sales commissions
- Production wages
- Utility costs
There are several defining characteristics of variable costs include:
- They fluctuate relative to production volume or sales volume
- They are the driver (cause) of total cost increases as production rises
- Consistent value in ‘cost per unit’ used for budgeting and forecasting
- They contrast with fixed costs, which remain steady regardless of activity level, such as rent, insurance, and salaries.
Variable costs vs fixed costs
The key difference between variable and fixed costs is flexibility (or variability). While fixed costs remain constant, variable costs change directly with output. For instance, a manufacturer that boosts production from 1,000 to 2,000 units will incur higher variable costs for materials and labour (paid by the hour), while fixed overheads like rent remain unchanged. Understanding the behaviour of variable vs. fixed costs is essential for apt budgeting, pricing decisions, and measuring operational efficiency. Managers can control variable costs more easily in the short-run by adjusting output.
When companies start a ‘cost cutting’ initiative, it is NOT the variable costs that can be eliminated.
Variable Costs Formula
When calculating variable costs, consider the formula:
TVC=VCu×Q
Where:
- TVC = Total variable cost
- VCu = Variable cost per unit
- Q = Quantity produced
This formula demonstrates that total variable cost fluctuates based on the number of units produced, while variable cost per unit remains constant.
How to Calculate Variable Costs in Excel
Calculating variable costs in Excel utilises the formula above, with steps including:
- Identifying the variable cost per unit, separating them from fixed costs
- Inputting the number of units produced
- Creating a column for total variable costs
- Utilising the VCu×Q formula to multiply variable cost per unit by units produced
- Summing the column to get total variable cost
Below is an extract from a budgeting exercise in our Finance for the Non-Finance Manager. You can see the VC per unit in Column E. For budgeting profit, we just estimate the Sales volume (2000 units) and put the (shown) formula against each variable cost input.
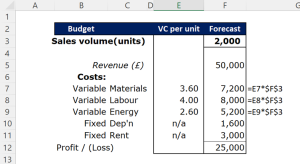
Excel enables easy sensitivity analysis by changing unit assumptions. Comparisons to fixed costs are also straightforward.
Factors Influencing Variable Costs
Although we said that variable cost per unit remains stable, there are several factors that can influence and change them:
- Economies of scale: Producing in larger volumes can reduce variable cost per unit due to bulk discounts on materials and enhanced productivity with division of labour.
- Efficiency: Employing more efficient production techniques like automation can reduce labour costs per unit.
- Supplier prices: Paying less for materials or services lowers variable costs.
- Product design: Simplifying or standardising product designs can curtail variable costs.
- Quality control: Maintaining consistent quality minimises waste and rework.
Managing these factors diligently allows companies to boost margins by reducing variable cost per unit.
Interpreting Variable Costs in Corporate Finance
Variable costs play a pivotal role in financial modelling, analysis, and corporate decision-making.
- Budgeting: Revenue−Variable costs=Contribution margin. Analysing contribution margins to set feasible targets.
- Cost-volume-profit analysis or Break-even Analysis: Identifying break-even points considering both fixed and variable costs – see example below.
- Pricing: Price=Variable cost per unit+Markup. The markup must exceed fixed costs.
- Production level: Maximising profit by producing where marginal revenue equals marginal costs.
- Operating leverage: Identifying the sensitivity of profits to sales changes. A higher proportion of variable costs signifies higher leverage.
- Efficiency: A smaller proportion of variable costs relative to sales indicates heightened efficiency.
- External Factors: Variable costs can be influenced by external market forces such as inflation, global economic conditions, or changes in legislation which can impact material, labour, and utility costs. An adaptive strategy considers these externalities to manage costs proactively.
Understanding the nuances of variable cost behaviour equips companies to make more informed and strategically sound business decisions.
Comparison with Other Cost Types
- Fixed Costs: As established, these do not fluctuate with production volume and are incurred even if production is zero.
- Semi-variable Costs: These costs contain both fixed and variable components and partially alter with production changes. For instance, a monthly telephone bill might have a fixed subscription charge plus additional costs per call made.
- Step-variable Costs: These remain constant for a range of production levels but step up or down once a certain threshold is reached. Adding an extra shift or production line might incur such costs.
Understanding the nuances and applications of each cost type in various scenarios enables comprehensive cost management and optimal financial planning.
Exercises and Examples for Variable Costs
Let’s explore some exercises and examples to practice calculating variable costs:
Example 1 – Budgeting
A manufacturer produces toys at a variable cost per unit of $5 and fixed costs of $100,000 per month. In January they produced 20,000 units. What are the total variable and fixed costs? Why does this information help?
Solution:
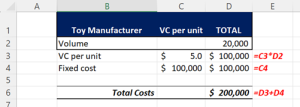
The total variable costs are $100,000. Total fixed costs don’t move at $100,000. So total costs are $200,000.
This information will help management with pricing strategy and help they review performance should volumes differ from budget.
Example 2 – Cost Categorisation
A retailer has the following costs last month. The finance manager wants to categorise them to enable accurate budgeting. What are the categories: variable, fixed or semi-variable?
- Rent: $5,000
- Salaries: $4,000
- Inventory: $7,000
- Commissions: $3 per unit sold
- Units sold: 1,000
Categorise each cost as fixed or variable:
Solution:
Rent = Fixed. It will ‘step-up’ at some point as capacity increases and more space is needed, but in the short term it is Fixed.
Salaries = Fixed. Generally salaries are fixed, but it may be the case that if the retailer has to pay overtime when the shop is busy. So, they can also be classified as semi-variable.
Inventory = Variable. Always! We only incur higher costs if we manufacture / buy more.
Commissions = Variable, always. Commissions rise with sales volume or value.
This information will assist in forecasting and budgeting. The finance manager needs to flag up which costs will rise as sales activity increases.
Example 3 – Break-even Analysis
A drinks manufacturer sells bottles of lemonade. The selling price is $5/bottle. Variable costs of $2/bottle and fixed costs of $90,000.
What is the breakeven volume in units? I.e., how many bottles does it have to sell to cover its fixed costs and just break even?
Solution:
Firstly, note the idea of ‘contribution’ to profit. This is the idea that every unit bought and sold adds Revenue and (variable) costs to the P&L.
Fixed: $90,000
Contribution per unit = $5 revenue – $2 variable cost = $3
Break even volume is $90,000 / £3 = 30,000 bottles.
If the company sells 30,000 it will only just break-even. To make a profit it needs to sell more!
Mastering the analysis of how costs behave enables companies to make astute decisions around budgeting, pricing, production levels, and elevating efficiency, thereby driving business sustainability and growth.
To find out more on costs, budgeting, accounting and other core financial knowledge, look at our Finance for the Non-Financial Manager e-learning course.

Former banker turned entrepreneur. I successfully restructured, purchased, managed and sold a private engineering group, Steel Line Ltd, through an LBO and was also an equity partner in Corporate Training Group which my partners and I successfully sold to the AIM listed ILX group in 2006. I established Capital City Training Limited in early 2010 with my business partner Greg. We acquired MS Consultants a few years ago (so I’m still doing a bit of M&A). I have had non-exec roles for a small and growing VA/recruitment business and a fast-growing beverage logistics company. I am also an active investor.
Capital City Training is a full service technical and management development training company focused on the banking, wealth management and broader financial services and accounting industries. Having said all that, in the last couple of years we’ve been branching out into training for non-financial companies – manufacturing, retail, tech, defense.. so old and new economy. We also provide consultancy around modelling and are currently working for a leading PPP/PFI advisory firm. We have delivered training in every continent of the world in 2024… except Antarctica. Perhaps in 2025?! Watch this space.
Capital’s dedicated faculty combine extensive line experience as corporate financiers, bankers, traders, portfolio managers and equity analysts together with over 60 years of experience in learning and development as both procurers and providers of tailored in-house training, eLearning and blended learning. Our faculty also includes experienced Management development training specialists allowing us to provide HR consultancy services, management development training and also innovative integrated management development & technical training events. Capital City’s faculty embody over 100 years of line experience across the fields of accounting, corporate finance, derivatives, credit, lending, investment, equity research transaction banking and origination.