How to Analyse the Balance Sheet
The balance sheet is one of the most core financial statements, providing a comprehensive snapshot of a company’s financial health at a specific point in time.
Analysing a balance sheet requires a systematic approach and a keen eye for detail. By dissecting each component and understanding their relationships with cash flows, profits, or other income, you can uncover valuable information about a company’s financial strengths, weaknesses, and strategic positioning.
Article Contents
- What is the Balance Sheet?
- Components of a Balance Sheet
- Assets
- Liabilities
- Equity (or Shareholders’ Funds)
- Balance Sheet Equation
- What can we learn from the Balance Sheet?
- Common Analysis Tasks on the Balance Sheet
- Limitations and Pitfalls of Balance Sheet Analysis
- Balance Sheet Examples and Case Studies
Key Takeaways
| Aspect | Key Takeaways |
| Definition | The balance sheet provides a snapshot of a company’s financial position at a specific point in time, showing its assets, liabilities, and shareholders’ equity. |
| Components |
|
| Equation | Assets = Liabilities + Shareholders’ Equity |
| Purpose |
|
| Common Analysis Tasks |
|
| Limitations |
|
What is the Balance Sheet?
The balance sheet, more formally referred to as the statement of financial position, is a comprehensive financial statement that provides a snapshot of a company’s assets, liabilities, and shareholder equity at a specific point in time. It is a fundamental document that reflects the overall financial condition of a business and serves as a valuable tool for stakeholders, investors, and management to assess the company’s financial health.
The balance sheet adheres to the fundamental accounting equation:
Assets = Liabilities + Shareholder Equity
This equation represents the balanced relationship between what a company owns (assets), what it owes (liabilities), and the residual value owned by shareholders (equity).
I like to think of the balance sheet as simply
- Assets = What the business owns / controls
- Liabilities + Equity = How the assets were funded
Components of a Balance Sheet
A typical balance sheet consists of three main components: assets, liabilities, and shareholder equity; and each of these components is presented in more detail with subheadings and then even more detail can be found in the notes to the financial statements. Let’s explore each of these components in detail:
Assets
Assets represent the economic resources owned by a company that are likely to generate future benefits or cash flows. Assets can be classified into various categories based on their liquidity, tangibility, and intended use.
- Current Assets – These are assets that are expected to be converted into cash or consumed within one operating cycle or one year, whichever is shorter. Examples include cash and cash equivalents, accounts receivable, inventory, and prepaid expenses. Prepaid expenses are an asset because the company will receive the economic benefit at some future point in time – and that’s the defining characteristic of an asset!
- Non-Current Assets – which may be tangible or intangible.
- Tangibles are physical assets controlled by the company and are expected to provide benefits over the longer term – that is, beyond the current financial year. Examples include property, plant, and equipment (PP&E), such as land, buildings, machinery, and vehicles.
- Intangible Assets are non-physical assets that lack physical substance but possess economic value. Examples include brands, licences, patents, trademarks, copyrights, and other intellectual property.
- Investments (or ‘Financial Assets’) – These can include long-term investments in stocks, bonds, or other securities held by the company.
Liabilities
Liabilities represent the financial obligations that a company owes to external parties. Accountants prefer to think of these as ‘non-equity claims over the assets of the business.’ The most common being Borrowed Money (like loans) and Accounts Payable (trade creditors). But just like assets, liabilities will be classified into Current (short term, due to be paid within 1 year of the balance sheet date) and Non-current (longer-term: due to be paid after 1 year) and within these headings you will find a variety of categories. The most common types of liabilities include:
- Current Liabilities – These are obligations that are expected to be settled within one operating cycle or one year, whichever is shorter. Examples include trade creditors (amounts owed to suppliers), short-term loans, accrued expenses, and current portions of long-term debt.
- Non-Current Liabilities (long-term) – These are obligations that are due beyond one year. Examples include long-term loans, bonds that mature after 1year, longer term tax liabilities, and pension obligations.
Equity (or Shareholders’ Funds)
Equity, also known as net worth or owner’s equity, represents the residual value of a company’s assets after deducting its liabilities. It represents the ownership interest of shareholders in the company.
Equity will always be the same as Net Assets (Total assets less Total liabilities) as it is a simple case of the balance sheet equation:
- Assets(A) = Liabilities(L) + Equity (E) OR A – L = E
But equity can be further divided into 2 key components:
- Paid-in Share Capital – When shares are issued by the company, this represents the contribution paid by the shareholders.
- Retained Earnings – This represents the cumulative net income or losses that have been earned by the company over its lifetime, but NOT paid out in dividends. Any surplus earnings not paid out as dividends are still invested in the balance sheet assets, so they are sometimes referred to as reinvested earnings.
You may also see withing Equity:
- Treasury Stock – This represents shares bought back by the company from the shareholders. This represents the company’s own shares that have been repurchased from the market and are held in the company’s name. They are not owned by anyone else, and they do not earn dividends (if they did, the company would just be paying cash to itself!)
- Non-Controlling Interest (NCI) – This shows the amount of equity invested in company assets by minority investors from outside the group. Eg the main /parent company of a group may own just 90% of equity in one of its operating companies. It would show all 100% of that operating company’s net assets, but show 90% is owned by itself (its own equity) and the other 10% would be the minority shareholder’s equity (NCI)
Balance Sheet Equation
The balance sheet equation, also known as the accounting equation, is a fundamental principle that underpins the structure of the balance sheet. It states that a company’s total assets must equal the sum of its total liabilities and shareholder equity. It’s what double-entry book-keeping was designed to build! Mathematically, it can be expressed as:
Assets = Liabilities + Shareholder Equity
This equation ensures that the balance sheet remains in balance, reflecting the overall financial position of the company. Any transaction or event that affects one side of the equation must also impact the other side, maintaining the equality.
We have a ‘build the balance sheet’ exercise you can try out in our Investment Banking Fundamentals e-learning course – it’s free! It doesn’t aim to teach you to be an accountant, it just arms you with enough knowledge to be able to follow the numbers through and make sense of them!
What can we learn from the Balance Sheet?
The balance sheet provides valuable insights into various aspects of a company’s financial health and performance. By carefully analysing the components of the balance sheet, stakeholders can gain an understanding of:
- Financial Strength and Solvency – The balance sheet shows financial obligations (liabilities) and the cash available to repay them, or the assets employed to generate cash to repay them. So, it can reveal a lot about a company’s ability to meet its term financial obligations and its overall financial stability.
- Liquidity Position – ‘Liquidity’ is about near-term ability to meet immediate (short term) liabilities. In the balance sheet we have Current Liabilities and Current Assets, and the relationship between these two provides insights into a company’s ability to meet its short-term obligations (remain liquid).
- Asset Composition and Utilisation – The balance sheet shows the types of assets owned by the company, their relative proportions, and – in conjunction with the P&L – how efficiently these assets are being utilised to generate revenue and profits.
- Capital Structure – The balance sheet reveals the company’s financing mix – the relative proportions of debt and equity. Too much debt relative to assets, especially compared to peers, can be a red flag for investors. Rember that debt is efficient financing though (it’s cheaper than equity and attracts tax relief on interest payments) – so you can use the balance sheet to see whether the amount of debt is optimal.
- Growth Potential – The balance sheet can indicate a company’s capacity for future growth by analysing its retained earnings, asset base, and access to external financing sources based on its existing balance sheet structure and scale.
By interpreting the balance sheet in conjunction with other financial statements, such as the income statement and cash flow statement, stakeholders can gain a comprehensive understanding of a company’s overall financial performance and make informed decisions.
Common Analysis Tasks on the Balance Sheet
When analysing a balance sheet, there are several common tasks and calculations that can provide valuable insights into a company’s financial condition. Here are some of the most common analysis tasks:
- Liquidity Analysis – This involves calculating and evaluating liquidity ratios, such as the current ratio and quick ratio, to assess a company’s ability to meet its short-term obligations.
- Solvency Analysis – This involves calculating and evaluating solvency ratios, such as the debt-to-equity ratio and debt-to-assets ratio, to assess a company’s ability to meet its long-term obligations and its overall financial leverage.
- Asset Utilization Analysis – This involves evaluating the efficiency with which a company utilizes its assets to generate revenue and profits, often through ratios such as asset turnover and inventory turnover.
- Capital Structure Analysis – This involves analysing the composition of a company’s capital structure, including the relative proportions of debt and equity financing, and assessing the associated risks and opportunities.
- Trend Analysis – This involves comparing balance sheet data over multiple periods to identify trends and patterns that may reveal underlying issues or opportunities for improvement.
- Vertical Analysis – This involves expressing each balance sheet item as a percentage of total assets or total liabilities and shareholder equity, allowing for easy comparison and identification of relative proportions.
- Horizontal Analysis – This involves calculating the percentage change in balance sheet items between different periods, providing insights into the company’s growth or decline over time.
By employing these analysis tasks, stakeholders can gain a deeper understanding of a company’s financial position, identify potential risks or opportunities, and make informed decisions based on the available data.
Limitations and Pitfalls of Balance Sheet Analysis
While balance sheet analysis provides valuable insights into a company’s financial position, it’s crucial to recognize its limitations and potential pitfalls. By understanding these limitations, analysts can make more informed decisions and avoid drawing misleading conclusions.
- Snapshot in Time – The balance sheet represents a company’s financial position at a specific point in time. It does not capture the dynamic nature of a business or its ongoing operations. Consequently, balance sheet analysis alone may not provide a complete picture of a company’s performance or future prospects.
- Historical Data – Balance sheet data is historical in nature, reflecting past transactions and events. It may not accurately represent the company’s current or future financial situation, especially in rapidly changing business environments or industries.
- Accounting Practices and Assumptions – Balance sheet figures are based on specific accounting principles, methods, and assumptions. The majority of assets are measured at historic cost, and NOT fair value. On top of that, accounting rules allow assumptions and estimates to be used and different companies may use varying accounting practices, making it challenging to compare balance sheets across different organisations directly. In addition, only companies that BUY intangible assets (brands, licences, patents) can show that investment on the balance sheet. If a company creates its own brand, for example, the value is not shown on the balance sheet – it is created through incurring marketing expenses which go through the P&L.
- Off-Balance Sheet Items – Certain financial arrangements or transactions may not be fully reflected on the balance sheet, such as operating leases, contingent liabilities, or derivative contracts. Failing to consider these off-balance sheet items can lead to an incomplete understanding of a company’s financial position.
- Asset Valuation – The valuation of assets, particularly long-term or intangible assets, can be subjective and influenced by various factors, such as management assumptions, market conditions, and accounting methods. Imprecise asset valuations can distort the overall financial picture presented by the balance sheet.
- Window Dressing – In some cases, companies may engage in “window dressing” practices, where they manipulate balance sheet figures to present a more favourable financial position. These practices can mislead stakeholders and undermine the reliability of balance sheet analysis.
- Industry-Specific Considerations – Different industries may have unique balance sheet characteristics or items that require specific expertise and understanding. Failure to consider industry-specific factors can lead to inaccurate interpretations or inappropriate comparisons.
- Qualitative Factors – Balance sheet analysis primarily focuses on quantitative data, but it may not capture qualitative factors such as management quality, competitive advantages, or operational efficiencies, which can significantly impact a company’s financial performance.
To mitigate these limitations and pitfalls, analysts should:
- Complement balance sheet analysis with other financial statements (income statement, cash flow statement) and non-financial information.
- Understand the accounting principles and assumptions used by the company when interpreting balance sheet figures.
- Consider industry-specific factors and seek guidance from experts when analysing unfamiliar sectors.
- Remain vigilant for potential window dressing or manipulation of balance sheet data.
- Incorporate qualitative factors, such as management quality and competitive landscape, into their overall assessment.
- Regularly update their analysis as new information becomes available to reflect the company’s evolving financial position.
- By recognizing the limitations and potential pitfalls of balance sheet analysis, analysts can make more informed decisions and avoid drawing incomplete or misleading conclusions.
Balance Sheet Examples and Case Studies
To better illustrate the practical application of balance sheet analysis, let’s consider a few examples and case studies:
Example 1: ABC Ltd
ABC Ltd is a manufacturing company that produces and sells consumer electronics. Let’s analyse its balance sheet:
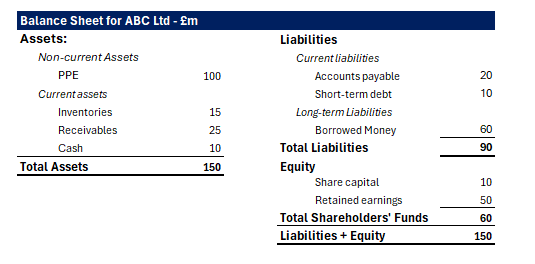
Analysis:
ABC Ltd has a current ratio of 1.67 (£50 million current assets / £30 million current liabilities), indicating a relatively strong liquidity position. Even excluding the relatively illiquid inventory, the quick ratio is >1 (receivables + cash / current liabilities) which is a healthy sign.
The debt-to-equity ratio is 1.5 (£90 million total liabilities / £60 million total equity), suggesting a moderate level of financial leverage. We would compare this to peers to see if is relatively stronger or weaker.
The company has significant property, plant, and equipment assets, indicating a capital-intensive business model.
With £50 million in retained earnings, ABC Corporation appears to have a history of profitability and reinvestment.
Case Study: XYZ Retail Ltd
XYZ Retail Ltd is a large retail chain that operates stores across multiple countries. Let’s analyse its balance sheet and examine the company’s financial position:
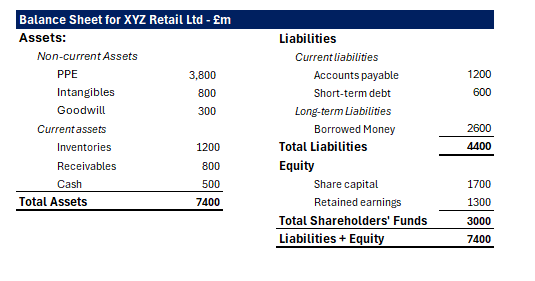
Analysis:
XYZ Retail Ltd has a current ratio of 1.39 (£2.5 billion current assets / £1.8 billion current liabilities), indicating a decent liquidity position but with potential room for improvement.
The debt-to-equity ratio is 1.47 (£4.4 billion total liabilities / £3 billion total equity), suggesting a moderate level of financial leverage.
The company has significant inventory levels, reflecting the nature of its retail business model. This should be compared to prior years and to its peers to see if it is managing inventory levels efficiently. Companies need to optimise inventory – avoiding stock-outs, but also not holding too much that it might become obsolete.
The substantial intangible assets highlight the importance of brand value in the retail industry – these must have been purchased brands, otherwise they would not be on the balance sheet. The goodwill tells us it has grown through acquisition of other businesses – to maintain competitive advantage that might be slow or uncertain to create internally.
With £1.3 billion in retained earnings, XYZ Retail Ltd appears to have a consistent history of profitability and reinvestment.
By analysing these examples and case studies, you can gain a better understanding of how balance sheet analysis can provide valuable insights into a company’s financial position, strengths, weaknesses, and potential areas for improvement.
The balance sheet stands as a powerful tool for understanding a company’s financial health and making informed decisions. By mastering the art of balance sheet analysis, stakeholders can gain valuable insights into a company’s asset composition, liability structure, equity position, and overall financial stability. Through the careful examination of balance sheet components, the calculation of key ratios, and the identification of trends and patterns, analysts can uncover crucial information about a company’s liquidity, solvency, asset utilization, and growth potential.
Balance Sheet FAQs

An experienced finance and training professional and Co-Founder of Capital City Training Ltd, Greg has a demonstrated history of working in the financial services sector and has a passion for sharing his knowledge and skills throughout the financial services sector. He has been partnering financial and corporate clients in designing and delivering applied financial programs that make an impact on business outcomes. Greg is skilled in accounting & financial analysis, derivatives and risk management, financial modelling, business valuation and corporate finance and has worked with the worlds leading financial institutions. A strong business development professional and a qualified accountant (ICAEW member), CFA Charterholder and Associate Member of the Association of Corporate Treasurers in the UK (ACT).