Guide to Financial Statements
Financial Statements are the single most valuable source of financial information on a business – providing valuable insights into a company’s financial health and performance.
As a manager, investor, shareholder, employee, supplier, customer, government, or a creditor, having the ability to analyse and interpret financial statements is a critical skill for making informed decisions about a business.
The 3 key financial statements which you need to understand at a high level are:
- The Income Statement or profit & loss (P&L)
- Cash Flow Statement
- The Balance Sheet or, more formally, the Statement of Financial Position
However, these are not the only financial statements – the Statement of Changes in Equity and the Statement of Comprehensive Income are also relevant for analysis. In the US, the Statement of Retained Earnings is also often referred to.
With the right knowledge and techniques, financial statements can reveal the underlying story of a company’s success – or otherwise!
Article Contents
Key Takeaways
| Financial Statement | Purpose | Key Takeaways |
| Balance Sheet | Shows assets, liabilities, and equity at a point in time | – Assesses liquidity, leverage, working capital, net asset value
– Analyze composition and trends in assets, liabilities, equity |
| Income Statement | Shows revenues, expenses, and profit/loss over a period | – Analyze revenue growth, profit margins, expense trends
– Compare to industry and past performance – Identify variances and underlying causes |
| Cash Flow Statement | Shows sources/uses of cash during a period | – Analyze cash flow trends and categories (operations, investing, financing)
– Assess cash flow vs. net income – Evaluate cash flow sustainability |
| Statement of Changes in Equity | Details changes in equity accounts | – Analyze drivers of equity changes (earnings, dividends, share issuance etc.) |
| Statement of Comprehensive Income | Shows profit/loss and other comprehensive income | – Assess impact of items not included in net income (foreign currency adjustments, hedges etc.) |
Types of Financial Statements
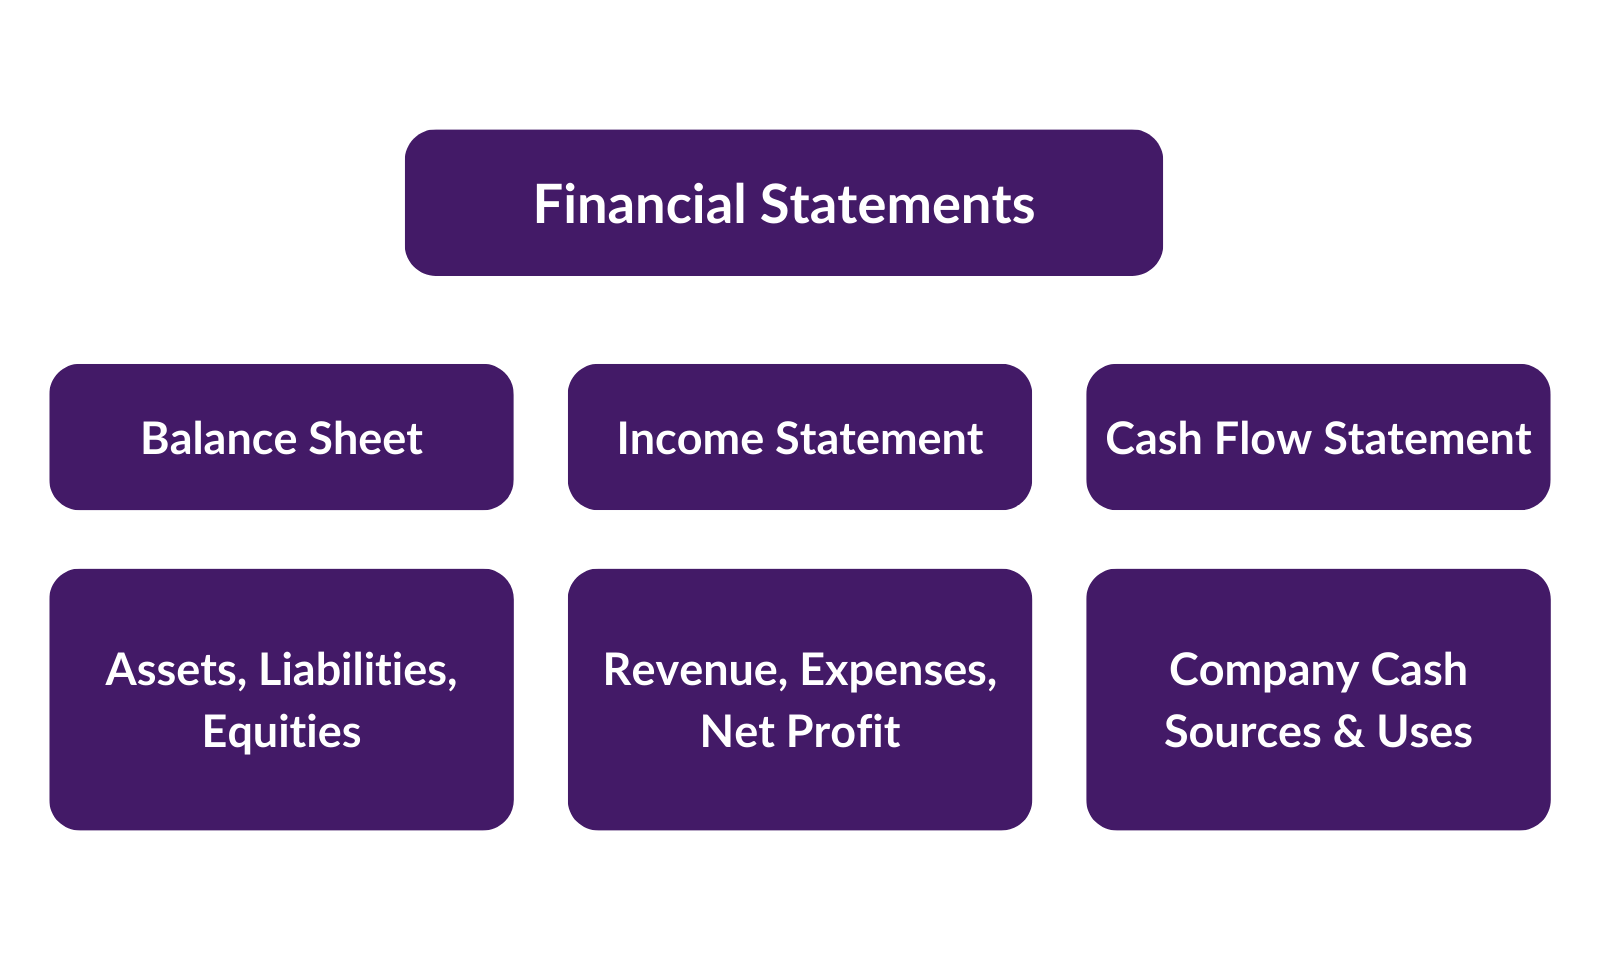
The first step is to understand the components of financial statements and their purpose. The three primary financial statements are:
- The Balance Sheet – The balance sheet shows a company’s assets, liabilities, and shareholders’ equity at a specific point in time.
- The Income Statement – The income statement shows revenue, expenses, and net profit or loss over a period of time
- Cash flow statement – the cash flow statement shows the sources and uses of a company’s cash during a period. It explains changes in the company’s cash balance
While these core statements are prepared using standardized accounting principles to enable comparability between companies and across reporting periods, it’s important to note that variations in accounting policies and interpretations can still lead to differences. Investors should be aware that these variations can affect the direct comparability of financial statements across different companies, making it crucial to understand the specific accounting practices employed.
Financial statements are rich with data, yet extracting meaningful insights requires not only practice but also a deep understanding of the industry context and prevailing economic conditions. It’s essential to analyse these statements within the broader industry and economic framework, as sector-specific factors and macroeconomic trends can significantly influence financial performance and outlook.
Focus on year-over-year trends and be wary of relying too much on results from a single year, which may not be indicative of longer-term trends. Also, read the accompanying footnotes which explain policies and provide additional details that may significantly impact the interpretation of the financial statements.
How to Read Financial Statements
Balance Sheets
The balance sheet provides the base for financial analysis. At the highest level, it is simply an ‘equation’:
Assets = Liabilities + Equity
Or:
Assets – Liabilities = Equity
Broken down, these are:
- Assets – what does the business own, or is owed by other parties? (E.g. Property, equipment, inventories, money owed by customers)
- Liabilities – what does the business owe (e.g. borrowings or other creditors)
- Equity – this comprises two key elements:
- Money invested into the company by its shareholders, plus
- Any accumulated profits reinvested in the business (also known as retained earnings)
Of course, the balance sheet presented in the financial statements shows a lot more detail than this simple equation, and the assets, liabilities and equity are broken down into component elements, the details of which are further explained in the ‘Notes to the Accounts’.
Assets
The Assets section of the balance sheet has categories for Non-Current Assets and Current Assets. Current assets are resources that are cash, near cash, or expected to be converted into cash in the short term (less than one year). This includes cash, accounts receivable, inventory, and short-term investments. Non-current assets are long-term resources like plant and machinery, IT equipment, long-term investments, and perhaps intangible assets like brands, licences. They are assets that are invested in for the long-term (more than just the current accounting period)
Liabilities
Similar to the categorisation of assets, liabilities are split into two headings:
- Current liabilities – are amounts due to be paid within one year, such as accounts payable (due to your suppliers), borrowed money due to be repaid within 1 year, accrued expenses (incurred but not yet paid) and tax.
- Non-current liabilities – are amounts due to be paid after one year, such as long-term debt.
Shareholders’ equity
Comprised of paid-in capital from stock issuance and accumulated earnings from profitable operations (or ‘retained earnings’ meaning it is profit reinvested in the business assets and not paid out as dividends).
Common Balance Sheet Analysis Tasks
Financial analysts will use a balance sheet to understand the company’s:
- Liquidity – e.g. comparing levels of current assets to current liabilities,
- Leverage – e.g. looking at debt levels relative to equity or earnings,
- Working capital – how much is invested in inventories? how much is due from customers? How high are accounts payable? In particular, are they moving in line with business growth
- Net Asset Value – Assets less liabilities, which also equals the book value of equity
Analysing Non-Financial Assets on the Balance Sheet
Intangible assets like intellectual property, brand value, and customer relationships can be significant drivers of a company’s value. However, these assets are often not captured in traditional balance sheet metrics. This is because of strict accounting rules relating to ‘self-generated’ assets. Analysing these assets requires a qualitative (and thus subjective) approach, considering factors like brand strength, market position, and customer loyalty, which can provide a more complete picture of the company’s assets.
Income Statements
While the balance sheet shows a snapshot in time of assets owned and liabilities due, the income statement details performance of the business over a set (usually 1 year) period. It outlines revenues earned and expenses incurred to arrive at net profit or loss for the company over the reporting period. Generally, income statements span one quarter or one year. Note that revenue ‘earned’, and expenses ‘incurred’ doesn’t necessarily mean the cash is received or paid. Hence the need for the Cash Flow Statement, to identify those differences.
How is the income statement calculated?
Starting at the top line of the P&L and working down the statement, the order of items is consistently presented. The top line shows operating revenues – those earned from the company’s core business activities (delivering services or selling goods). They do not include earnings from selling non-current assets, for example, or investment income.
Common expenses include cost of goods sold, sales and marketing costs, research and development costs, and general and administrative expenses.
Revenue less Cost of Goods Sold gives what is known as Gross Profit. Note that Cost of Goods Sold is named as such for a very good reason! – it is only the cost of the goods sold to customers that is included, not the cost of what has been purchased in the period. Then subtracting other operating expenses (sales, marketing, distribution) from revenues gives operating profit.
Then finance-and tax related items are added / deducted to arrive at the final net profit (also ‘net income’) or loss.
Common Income Statement Analysis Tasks
Using the income statement, analysts and investors will typically:
- Analyse income statement trends over time, especially for revenues, expenses, and profit margins
- Look at growth rates and profitability ratios like gross margin, operating profit margin and net margin.
- Compare to peers and industry averages and past performance to gauge operational efficiency and management effectiveness.
- Identify major variances from prior years and their underlying causes
This will provide some insight as to whether the business is improving, deteriorating and whether management strategy is working to improve returns to shareholders
Impact of Non-recurring Items on Income Statements
Non-recurring items, which are unusual and infrequent in nature, can significantly impact a company’s income statement. It’s important to identify and understand these items, as they can distort the true operating performance. Adjusting for extraordinary items provides a clearer picture of a company’s recurring profitability and operational efficiency. Adjusting for these, we essentially remove ‘noise’ from our analysis. Of course, you cannot ignore them altogether as they can be ‘red flags’ that require further interpretation or analysis. But by removing them it does help clarify the picture of underlying performance. We often talk about underlying earnings, or underlying EBITDA.
Cash Flow Statements
While income statements show profitability – based on the ‘accruals’ concept, cash flow statements depict actual cash generated and used. Profit does not equal net cash flow for a number of reasons. For example, you may spend cash on inventory, but the inventory only gets recognised in the P&L when sold (‘Cost of Goods Sold’). There is also consideration of non-cash expenses like depreciation. Cash flow statements account for these disparities.
What’s in a cash flow statement?
Cash flows arise from three activities – operations, investing, and financing, and these are the three sub-headings in the Cash Flow Statement.
- Cash from operations includes receipts from revenues earned adjusted for cash expenses
- Cash from investing includes purchases or sales of non-current assets like property, plant, and equipment. It also includes cash spent / received from the purchase or sale of entire business units
- Cash from financing includes any cash flows relating to the capital financing of a business (debt or equity) e.g. issuing or repaying debt, equity issuance, share repurchases, and dividends
Just this categorisation of cash flows makes for tremendous value-added in analysing liquidity in a business. For example, you can see how much cash is generated purely from operations. A business’ cash balance may have increased from one year to the next, but is it organic, self-generated or is it due to borrowings or selling off valuable assets?
Common Cash Flow Statement Analysis Tasks
On a cash flow statement, we can:
- Analyse cash flow trends and the distribution across the three categories – operations, investing, and financing
- See the conversion of operating profit into operating cash
- Examine how cash flows tie to balance sheet changes from the beginning to end of the reporting period
Healthy companies generate sufficient operating cash flow to fund expansion and dividends. Rapidly growing companies will generate healthy operating profit, but the incremental investment in working capital and fixed assets may be a significant drain on cash. The cash flow statement will highlight these points quickly and clearly. Beware dependency on external financing which can be difficult to secure and isn’t necessarily appropriate.
Distinguishing Between Operating and Non-Operating Cash Flows
In cash flow analysis, distinguishing between operating and non-operating cash flows is crucial. Operating cash flows arise from a company’s primary business activities, while non-operating cash flows relate to financing and investing activities. This distinction helps in assessing the sustainability of cash flows and the company’s ability to generate cash from its core operations.

Statements of Shareholders’ Equity
Finally, a few points around the other elements of financial statements – firstly the Statement of Changes in Equity. Equity is typically a significant number in the balance sheet. Companies will normally have significantly more equity than debt – but there are always exceptions (such as banks!) The Statement of Changes in Equity provides additional details on changes to this equity account over the reporting period. As well as the impact of profits on Equity (retained earnings), it shows other details that are not part of the P&L It shows, as main points:
- Retained earnings beginning balance, net income/loss added to that balance, dividends paid out from that balance, and ending balance.
- Paid-in capital beginning balance, proceeds from new share issuance, the cost of share repurchases/redemptions, and ending balance.
- Comprehensive income comprising profit/loss along with other gains/losses. This comprehensive income includes elements of gain/loss that are not shown in the P&L (see below)
The overall statement will help us analyse what has caused changes in shareholders’ equity – is the company profitable? Issuing new shares? Buying back stock? Paying dividends? The statement provides greater clarity into these dynamics.
The Role of Shareholders’ Equity in Company Valuation
Shareholders’ equity plays a critical role in company valuation. It represents the residual interest in the assets of a company after deducting liabilities. In valuation, equity is often analysed in conjunction with earnings and cash flow metrics to determine a company’s worth. However, do note that the number in the Balance Sheet is not the market value of equity, it is a historic value based on capital paid in, net income (earnings) and dividends paid out. However, a deep dive into the components of shareholders’ equity can reveal insights into a company’s financial health and growth potential.
Statements of Comprehensive Income
The Statement of Comprehensive Income is like a 2nd P&L. It shows net income from the P&L, but then adds into the mix any other gains/losses to equity earnings that are not considered to be part of the core business / financing of the business and are as yet to be crystallised (i.e. they aren’t at a fixed value yet!). These items are called Other Comprehensive Income (OCI).
A couple of examples of Other Comprehensive Income might help.
- The change in value of a derivative position that is being held to hedge a transaction for the business. Although the change in value is a ‘real’ gain or loss to the company, the gain or loss is held as a number in OCI until the underlying business transaction is recognised in the P&L.
- Gains or losses from the translation of foreign businesses in the company group. These are not ‘caused’ by the management and will distort reported profits if put in the P&L. Also, they may be volatile (positive one year, negative the next etc.) so this ‘noise’ isn’t considered relevant to analysing core profitability. It has to go somewhere – to ensure the balance sheet balances – so OCI seems the most appropriate.
Advanced Financial Statement Analysis
More sophisticated analysis involves calculating financial ratios for cross-company comparisons and examining statement components. Useful ratios include profitability, liquidity, leverage, valuation, and efficiency ratios. Component analysis examines accounts like receivables, inventory, debt, capital expenditures, and research and development expense.
Percent change analysis tracks line items across reporting periods to identify large swings. Trend analysis examines increases or decreases over consecutive periods. Common-size analysis scales statements to make comparisons easier, like expressing all income statement accounts as a percent of total revenue. Ratio analysis measures relationships between statement accounts, like the current or quick ratios for liquidity.
Financial statement analysis is a cornerstone in making informed investment decisions. By dissecting the balance sheet, income statement, and cash flow statement, investors can gauge a company’s financial health, growth prospects, and risk profile. This analysis, combined with an understanding of market conditions and industry trends, can guide investors in identifying undervalued or overvalued stocks.
A framework for financial statement analysis
People who are new to reading financial statements are often looking for a pro-forma framework to crunch numbers and tell them what they need to look at. The thing is, every business is different and crunching numbers won’t give you answers, but the ratios will tell you where to ask further questions and seek explanations.
One rule of thumb for generating the analysis is to look at a line item in the P&L, Balance Sheet, or Cash flow statement, and ask yourself:
- What’s driving this number?
- What else is it linked to in the financials?
- Is there a relationship there that is established or changeable?
- If so, does it make sense?
For example, look at the Revenue in the P&L and consider:
- Is it growing or declining?
- What assets are driving the revenue and are they working efficiently?
- Is revenue converting to cash or are receivables going up more quickly?
- If revenue is growing, why?
- Is it volume or price?
- If it’s price, is it just inflation or is it real growth?
All numbers in the financials have a ‘linked’ corresponding number to help put it into context, so you need to know enough about financial statements to find the other number(s) and see if they stack up. It’s not a formula, it’s logic and understanding.
To find out more about interpreting and analysing financial statements, take a look at Capital City Training’s eLearning courses: Finance for the Non-Financial Manager and Financial Accounting & Analysis.
Financial Statement FAQs

Former banker turned entrepreneur. I successfully restructured, purchased, managed and sold a private engineering group, Steel Line Ltd, through an LBO and was also an equity partner in Corporate Training Group which my partners and I successfully sold to the AIM listed ILX group in 2006. I established Capital City Training Limited in early 2010 with my business partner Greg. We acquired MS Consultants a few years ago (so I’m still doing a bit of M&A). I have had non-exec roles for a small and growing VA/recruitment business and a fast-growing beverage logistics company. I am also an active investor.
Capital City Training is a full service technical and management development training company focused on the banking, wealth management and broader financial services and accounting industries. Having said all that, in the last couple of years we’ve been branching out into training for non-financial companies – manufacturing, retail, tech, defense.. so old and new economy. We also provide consultancy around modelling and are currently working for a leading PPP/PFI advisory firm. We have delivered training in every continent of the world in 2024… except Antarctica. Perhaps in 2025?! Watch this space.
Capital’s dedicated faculty combine extensive line experience as corporate financiers, bankers, traders, portfolio managers and equity analysts together with over 60 years of experience in learning and development as both procurers and providers of tailored in-house training, eLearning and blended learning. Our faculty also includes experienced Management development training specialists allowing us to provide HR consultancy services, management development training and also innovative integrated management development & technical training events. Capital City’s faculty embody over 100 years of line experience across the fields of accounting, corporate finance, derivatives, credit, lending, investment, equity research transaction banking and origination.