Liquidity Ratios Guide: Types, Formulas and Examples
Liquidity ratios are an important set of financial metrics used to analyse a company’s ability to cover its short-term obligations.
Companies fail not due to lack of profits in most cases, but due to their inability to meet their short-term cash requirements – i.e. they fail to pay suppliers, tax, bank loans or other financial obligations. The suppliers stop supplying, the banks recall their loans, the government gets angry at not receiving tax and the company goes bust.
Ratios in themselves do not give you definitive answers to questions, but they can highlight when problems are potentially arising, and companies are beginning to struggle.
To do this, you need to be able to pick up a set of financial statements and use the information intelligently. By comparing a company’s most liquid assets to its short-term liabilities, liquidity ratios provide insight into whether a company has enough cash on hand to cover its upcoming financial obligations. Monitoring liquidity ratios helps stakeholders understand a company’s financial health and resilience.
Liquidity refers to the ability of a company to convert assets to cash in order to pay off short-term liabilities and debt as they become due. Liquidity ratios evaluate a company’s capacity to meet short-term financial demands and provide insights into the adequacy of working capital.
Article Contents
- Understanding Liquidity Ratios
- Types of Liquidity Ratios
- Cash Ratio
- Quick Ratio
- Current Ratio
- Comparing Liquidity Ratios
- Liquidity Ratios Analysis Example
- Ratio Analysis
- Comparing Liquidity Ratios Across Industries
- Impact of Economic Cycles on Liquidity Ratios
- Liquidity Ratios in Small Business Context
- Real-world Applications and Examples for Liquidity Ratios
Key Takeaways
| Topic | Key Takeaways |
| Liquidity Ratios | Compare liquid assets to current liabilities to assess ability to cover short-term obligations. Higher ratio indicates greater liquidity and lower liquidity risk. |
| Types of Ratios | – Cash ratio: only cash and equivalents vs liabilities
– Quick ratio: cash, equivalents, receivables vs liabilities – Current ratio: all current assets vs liabilities |
| Analysis | Compare ratios over time and to industry averages. Analyze trends and benchmark against peers. Consider influence on other financial metrics. |
| Applications | Assess short-term cash positions and working capital. Guide financing, inventory, and cash flow decisions. Evaluate loan applications and set credit terms. |
Understanding Liquidity Ratios
Liquidity ratios are calculated by comparing a company’s liquid (cash or near-cash) assets to its current liabilities. Liquid assets are balance sheet accounts that can be easily converted to cash within a short period of time, say within 90 days or less. This includes cash and cash equivalents (like short-term investments), accounts receivable, inventory, and marketable securities.
Current liabilities are a company’s debts or obligations that are due within one year. This includes accounts payable, wages payable, taxes payable, short-term loans, accrued expenses, and the current portion of long-term debt.
By comparing liquid assets to current liabilities, liquidity ratios show a company’s ability to repay new and existing short-term debt. The higher the liquidity ratio, the larger the margin of safety to cover short-term debts. One question this pose is “what is a high ratio?”. Ratios are only meaningful when compared to the same ratio over time or compared to similar companies. Is it deteriorating or improving? Is it better / more liquid than its peers?
Types of Liquidity Ratios
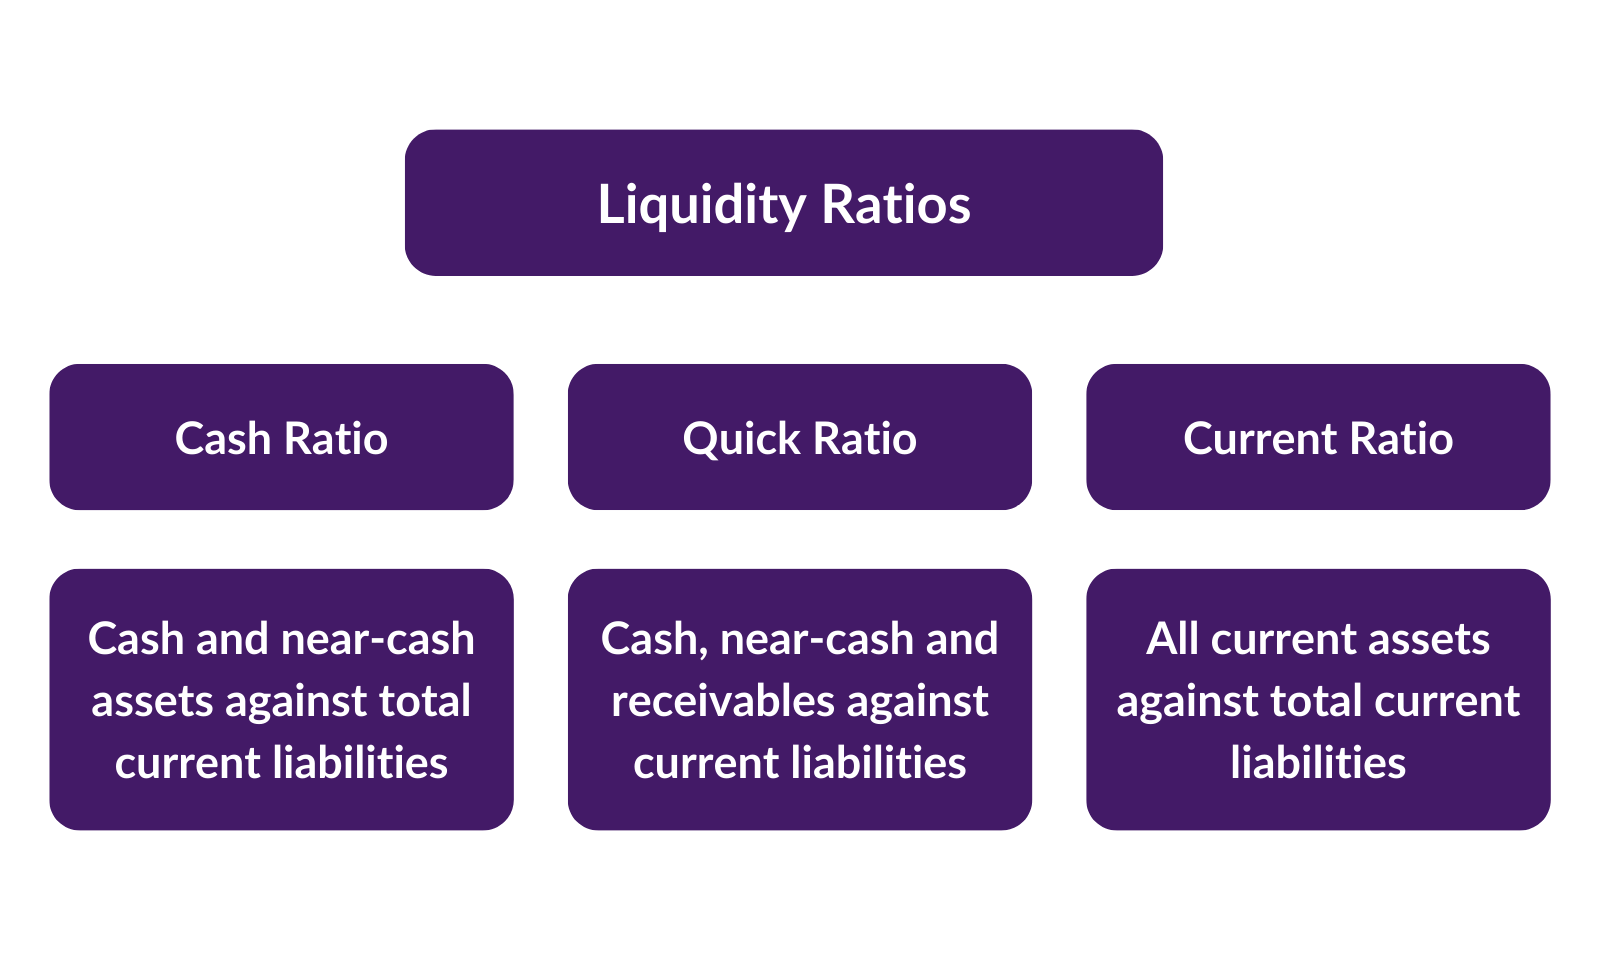
There are three primary types of liquidity ratios used in financial analysis:
- Cash Ratio – measuring cash and near-cash assets (the purest of ‘liquid assets’ ) against total current liabilities.
- Quick Ratio – uses cash, near-cash and receivables against current liabilities i.e. inventories are excluded.
- Current Ratio – compares all current assets, even inventory against total current liabilities.
Let’s look at each of these ratios in more detail:
Cash Ratio
The cash ratio is the most conservative liquidity ratio. It measures only cash and cash equivalents against current liabilities. Cash equivalents refer to assets that can be quickly converted into cash, typically within 90 days or less. This includes treasury bills, short-term certificates of deposit, and marketable securities.
Cash Ratio Formula:
(Cash + Cash Equivalents) / Current Liabilities
If cash / current liabilities >1, then the company can cover all its liabilities out of its existing cash reserves.
A higher cash ratio indicates a greater ability to pay off short-term obligations without needing to liquidate other assets, wait for customers to pay their invoices, or take on new loans. However, holding excessive cash can also mean a company is not maximizing its investment opportunities.
Quick Ratio
Also known as the ‘acid-test’ ratio, the quick ratio measures a company’s capacity to pay current liabilities without needing to sell inventory or get additional financing. It provides a more conservative view of liquidity position than the current ratio by excluding inventory from current assets. This is particularly relevant for a manufacturing company where, perhaps, much of the inventory is in the form of Raw Materials, or Work-in-Progress, in which case the company has to work through the entire operating cycle before that inventory can be sold. And then the company, if selling on credit terms, has to wait even longer to collect the cash from its customers. So, it is conservative to ignore inventories.
Quick Ratio Formula:
(Current Assets – Inventory) / Current Liabilities
The quick ratio focuses on assets that can be most readily converted to cash, which includes cash equivalents, marketable securities, and accounts receivable. A higher ratio indicates greater liquidity and lower liquidity risk.
Current Ratio
The current ratio compares all current assets to current liabilities and is the broadest liquidity ratio. Current assets include cash, inventory, accounts receivable, and other assets that can be converted to cash within one year.
Current Ratio Formula:
Current Assets / Current Liabilities
This ratio provides the most comprehensive assessment of a company’s ability to cover short-term obligations with its liquid assets. A relatively high current ratio indicates good short-term financial health while a low ratio may indicate greater liquidity problems.
Comparing Liquidity Ratios
Each of the three primary liquidity ratios provides a slightly different perspective on a company’s financial health. Generally, the following guidelines can be used when interpreting liquidity ratio results:
- Cash ratio – A ratio of 1.0 or higher is seen as very low liquidity risk. This means the company has sufficient cash on hand to cover current liabilities. However, it may indicate that the company is holding too much cash which is not efficient treasury management.
- Quick ratio – A ratio of 1.0 or higher is considered good. A ratio of 0.75-1.0 is adequate in some industries.
- Current ratio – A ratio under 1.0 indicates potential problems meeting short-term obligations. Ratios of 1.5-3.0 are common benchmarks for sufficient liquidity.
However, liquidity ratios should also be compared to industry peers and trends over time to get a better gauge of appropriate levels. The optimal current, quick, and cash ratios vary across different industries.
For illustration, here are some sector medians for liquidity ratios for public companies in the US:
| Manufacturing: | Retail: | Transport & Utilities: | |
| Cash ratio | 1.26 | 0.32 | 0.24 |
| Quick ratio | 1.55 | 0.61 | 0.75 |
| Current ratio | 2.88 | 1.27 | 1.08 |
Ratio Analysis
Along with assessing liquidity, financial analysts also examine liquidity ratios trends over time and compare ratio values to industry benchmarks. This provides a more in-depth evaluation of financial health.
Key aspects to analyse include:
- Year-over-year trends – improves or declines?
- Comparison to industry averages – above or below?
- Changes in working capital – assets or liabilities fluctuating more?
- Influence on other financial metrics – effects on leverage, margins, etc.?
Unusual fluctuations or divergence from industry norms requires further investigation into the underlying drivers and factors affecting liquidity.
Liquidity Ratios Analysis Example
Here is an extract from the 2023 interim financial statements of Sainsbury’s plc, the UK supermarket chain which also has a financial services division:
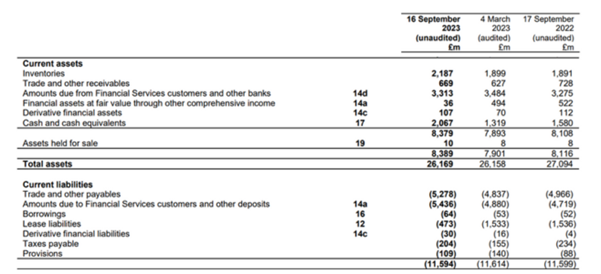
Cash ratio = Cash / Total Current Liabilities = 2,067/11,594 = 0.18, (prior year 0.14)
Quick ratio = Current Assets excluding inventories / Total Current Liabilities = (8,389 – 2,187)/ 11,594 = 0.535 (prior year 0.536)
Current ratio = Total Current Assets / Total Current Liabilities = 8,389 / 11,594 = 0.724 (prior year 0.70)
The ratios might look ‘low’ compared to the average corporate, but with such a rapid cash conversion cycle, you will find that supermarkets liquidity is low compared to other sectors.
Also note that the ratios are in line with, or slightly improved, compared to 2022. This is a good sign – the business is stable in its liquidity position, and it has not caused problems in the past.
The other thing you might want to do here is compared to peers, but before doing so you would probably want to remove the Financial Services assets and liabilities as this is a different business operation. Including this will give a ‘blended’ ratio that makes it harder compared to other supermarkets.
Impact of Economic Cycles on Liquidity Ratios
Economic cycles significantly influence the financial performance of companies, and liquidity ratios are no exception. You can expect companies to have volatile ratios during economic swings,
During growth phases, companies have more cash and receivables, enhancing their ability to cover short-term liabilities. Conversely, in recession periods, sales and cash flow may decline, putting pressure on liquidity ratios. Companies might face challenges in meeting their short-term obligations, leading to lower liquidity ratios.
Liquidity Ratios in Small Business Context
Liquidity ratios hold particular importance for small businesses, which often operate with tighter cash flows and limited access to credit compared to larger corporations.
For small businesses, maintaining a healthy liquidity ratio is crucial for ensuring operational stability and financial flexibility. A higher liquidity ratio generally indicates that a small business has enough liquid assets to cover its short-term liabilities, which is vital for sustaining operations, especially in times of financial uncertainty or slow business periods.
However, it’s important for small businesses to balance liquidity with efficiency. Excessive liquidity might mean that resources are not being utilized effectively for growth opportunities. Therefore, small business owners must carefully manage their assets and liabilities to maintain optimal liquidity levels that support both short-term stability and long-term growth.
Real-world Applications and Examples for Liquidity Ratios
Liquidity ratios have many practical uses for assessing real companies:
- Creditors – Banks use liquidity ratios to evaluate loan applications and set credit terms. A stronger liquidity position leads to better rates and borrowing capacity.
- Suppliers – Vendors analyse a customer’s ability to make timely payments for goods or services provided. Stronger liquidity lowers perceived risk.
- Investors – Shareholders and potential investors use liquidity ratios to assess short-term cash positions and working capital management. This informs investment decisions.
- Financial executives – CFOs monitor liquidity ratios to guide decisions on financing needs, capital expenditures, inventory levels, collections, and cash flow management.
For example, let’s say a company has $100,000 in cash, $200,000 of accounts receivable, $250,000 in inventory, and $150,000 in current liabilities. Its liquidity ratios would be:
- Cash ratio = $100,000 / $150,000 = 0.67
- Quick ratio = ($100,000 + $200,000) / $150,000 = 2.0
- Current ratio = ($100,000 + $200,000 + $250,000) / $150,000 = 3.33
This demonstrates how the current and quick ratios of this hypothetical company indicate good short-term liquidity. However, the low cash ratio highlights how it may run into trouble covering liabilities with only its cash on hand. Analysing all three ratios together paints a more complete picture of liquidity.
Evaluating liquidity through current, quick, and cash ratios provides vital insights into a company’s financial health and flexibility. Assessing liquidity trends over time and against competitors allows stakeholders to identify improving or deteriorating liquidity. With a comprehensive understanding of these fundamental ratios, financial analysts and managers can better monitor short-term financial performance.
")
Liquidity Ratios FAQs

An experienced finance and training professional and Co-Founder of Capital City Training Ltd, Greg has a demonstrated history of working in the financial services sector and has a passion for sharing his knowledge and skills throughout the financial services sector. He has been partnering financial and corporate clients in designing and delivering applied financial programs that make an impact on business outcomes. Greg is skilled in accounting & financial analysis, derivatives and risk management, financial modelling, business valuation and corporate finance and has worked with the worlds leading financial institutions. A strong business development professional and a qualified accountant (ICAEW member), CFA Charterholder and Associate Member of the Association of Corporate Treasurers in the UK (ACT).