Sharpe Ratio Explained: Definitions, Formulas and Examples
The Sharpe Ratio is one of the most popular risk-adjusted return metrics used in investment analysis and corporate finance. It was developed by Nobel laureate William F. Sharpe and helps investors understand the return of an investment compared to its risk. The ratio is useful for corporate finance professionals and investors looking to optimize a portfolio’s risk-return profile.
Article Contents
Key Takeaways
| Description |
|---|
| The compound average rate of return in a set of cash flows, or the discount rate where the net present value of an investment is zero. |
| 0 = Σ [CFt / (1 + r)^t] from t = 0 to n, where CFt = Net cash flow at time t, r = IRR, t = Time periods, and n = Overall number of time periods. |
| Requires an iterative process, usually done using Excel or a financial calculator. The IRR function in Excel has the syntax =IRR(cash flows, [guess]). |
| Regular cash flows (e.g. bond) have a single IRR, while irregular cash flows (e.g. with decommissioning costs) can have multiple IRRs. |
| Comparing returns, estimating returns, evaluating hurdle rates, capital rationing, and investment proposal screening. |
| Net Present Value (NPV), Payback Period, and Return on Investment (ROI). |
| Intuitive percentage return, recognizes time value of money, and relatively easy to compute. |
| Can yield multiple solutions, may inaccurately estimate profitability, assumes cash inflows are reinvested at the IRR rate, and can conflict with NPV. |
| Helps identify strategic choices, evaluate risk, communicate with stakeholders, and benchmark against competitors. |

What is the Sharpe Ratio?
An investor cannot earn high returns without high risk! Think of risk as the ‘cost’ of achieving higher returns. The Sharpe ratio is a way of standardising returns so investors can see how much return they get for each unit of risk taken.
The Sharpe Ratio actually measures the excess return (or risk premium) per unit of risk in an investment asset or a trading strategy. The risk is measured using the asset or strategy’s standard deviation of returns. The key purpose of the metric is to enable investors to assess how well the return of an asset or portfolio of assets compensates the investor for the risk taken. It is a standardised measure, meaning it can be used to compare performance of different investments fairly and objectively.
Sharpe Ratio Formula
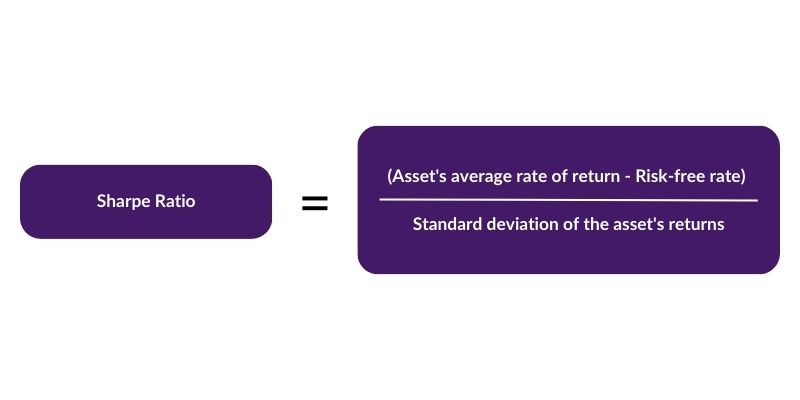
To calculate the Sharpe Ratio, use the following formula:
Sharpe Ratio = (Ra – Rf) / σa
Where:
- Ra = Asset’s average rate of return
- Rf = Risk-free rate. Taken usually as the return on short-dated treasury bills.
- σa = Standard deviation of the asset’s returns
A superior Sharpe Ratio indicates that the investment return is greater relative to the risk taken on the portfolio or asset. It quantifies the excess return (or risk premium) per unit of risk.
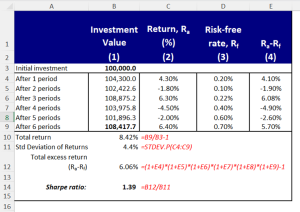
How to Calculate Sharpe Ratio in Excel
The Sharpe Ratio can be easily calculated in Microsoft Excel using the following steps:
- Obtain the asset’s rate of return over a time period and calculate the average return. This is the Ra.
- Identify the relevant risk-free rate over the period. The 3-month Treasury bill rate is commonly used. This is the Rf.
- Calculate the standard deviation of the asset’s returns. This is the σa.
- Input these variables into the Excel Sharpe Ratio formula:
=(Ra-Rf)/σa
The result is the Sharpe Ratio. Generally, a higher positive Sharpe Ratio signals better historical risk-adjusted performance.
Interpreting the Sharpe Ratio in Corporate Finance
In corporate finance, the Sharpe Ratio aids analysts and investors in evaluating the return-to-risk trade-off of a particular investment, project, or firm’s shares, offering several key interpretations:
- A higher Sharpe Ratio indicates superior risk-adjusted returns in comparison to other investments or the market. It signals better historical returns per unit of total risk taken.
- A negative Sharpe Ratio suggests that the risk-free rate would have been a more advantageous investment choice than the asset.
- Comparative Analysis can be conducted using the Sharpe Ratio to rank and compare multiple investments or strategies based on their efficacy in generating returns against historical volatility.
- Strategic Evaluation is facilitated as corporate managers can determine whether taking on additional risk for a project or venture has been historically compensated by sufficiently higher returns.
- Risk-Return Profile Analysis enables firms to compare the historical Sharpe Ratios of their own stock versus the market to acquire a clearer understanding of their risk-return profile.
Applicability in Different Market Conditions
- Bull Markets: A higher Sharpe Ratio may sometimes reflect the general bullish trend rather than a robust investment strategy.
- Bear Markets: A positive Sharpe Ratio during a market decline can indicate proficient management and strategy creation, managing to yield returns amidst adversity.
- Volatility: In volatile markets, the Sharpe Ratio could be artificially inflated or deflated due to larger standard deviations, warranting cautious interpretation.
Advantages and Disadvantages
Here are some key pros and cons of using the Sharpe Ratio:
Advantages:
- Accounts for the risk taken to generate returns using standard deviation of returns.
- Can easily be used to compare across multiple assets and strategies by their Sharpe Ratios.
- Only requires readily available data to calculate – the returns and their standard deviation, risk-free rate data
- The most widely used and recognized risk-adjusted return metric in funds and investment analysis
Disadvantages:
- Focuses only on market (price) risk, ignores other risk factors like liquidity, credit, operational risks.
- Prone to manipulation by managers
- May incentivise risk-taking behaviour if used in management compensation.
- Does not work well for assets and strategies with non-normal return distributions.
- Can give counterintuitive results for negatively skewed strategies.
Alternatives to the Sharpe Ratio
While the Sharpe Ratio is prevalent and recognized, it’s crucial to consider alternative metrics that might be fitting in different scenarios:
Sortino Ratio
This metric considers only the downside deviation as harmful, offering a more precise view of undesirable volatility. The formula for the Sortino Ratio is:
(Rp – Rf) / Downside Deviation
Treynor Ratio
The Treynor Ratio uses beta (systematic risk) as the risk measure, suitable for diversified portfolios. You can calculate this using the formula:
(Rp – Rf) / βp
Information Ratio
Evaluates the skill of a portfolio manager by considering the excess return over a benchmark index (the ‘alpha’) per unit of tracking error (standard deviation of the alpha).
(Rp – Rb) / Tracking Error
Where
- Rp = return on the portfolio
- Rb = benchmark return (similar risk benchmark)
- Tracking error = std deviation of the excess portfolio return
The information ratio is sometimes referred to as the ‘skill’ ratio. Why? Well consider the interpretation of a high Info Ratio: it means that a portfolio is consistently generating returns in excess of the benchmark (consistent = low standard deviation of alpha) and this takes skill on the part of the portfolio manager!
These metrics often complement the Sharpe Ratio, providing a more comprehensive view of investment performance and risk.
Exercises and Examples for Sharpe Ratio
Let’s look at some illustrative examples and exercises to better understand Sharpe Ratio calculations:
Example 1
Stock A has an average annual return of 12% over the last 5 years. The return on T-Bills over the same period (risk-free rate) was 3% per year. If Stock A’s returns have a standard deviation of 20%, what is its Sharpe Ratio?
Solution:
- Ra = 12%, Rf = 3%, σa = 20%
- Sharpe Ratio = (Ra – Rf) / σa
- = (12% – 3%) / 20%
- = 0.45
The Sharpe Ratio, despite its limitations, is a pivotal metric for evaluating the historical risk-adjusted returns of assets and strategies in corporate finance. It endures as a primary tool to optimize investment and capital budgeting decisions when employed alongside other risk metrics and qualitative factors. Employing a mix of these metrics ensures a balanced, well-informed investment strategy, accommodating a variety of risk factors and market conditions.
Learn more about investment analysis in our Accounting and Analysis course.