Investment Risk and Return
Balancing and managing returns and risk on investment is the fundamental role of a fund manager. Measuring risk, historic returns and estimating expected returns from assets and asset classes are critical concepts in corporate finance, investment analysis and fund management. Investors and financial managers aim to maximise returns while minimising risk. This requires understanding of the different types of risks; ways to measure risk and return; risk management strategies; and the impact of risk-return trade-offs in investment decision-making.
Article Contents
Key Takeaways
| Aspect | Key Takeaways |
| Risk and Return | – Risk refers to the potential for loss or variance from expected returns
– Return is the gain or loss from an investment over a period – Investors aim to maximize returns while minimizing risk |
| Types of Risks | – Market risk, business risk, financial risk, liquidity risk, interest rate risk, currency risk, country risk, inflation risk |
| Measuring Risks | – Standard deviation, beta, R-squared (correlation coefficient) |
| Measuring Returns | – Sharpe ratio, Sortino ratio, return on investment (ROI), internal rate of return (IRR), total return |
| Risk Management Strategies | – Diversification, hedging, asset allocation, investing in safe assets, limiting position sizes, portfolio monitoring and rebalancing, using advanced risk measures |
| Investment Decision Making | – No risk, no return
– Focus on total portfolio return, not individual assets – Diversify across asset classes and markets – Take on smart risks for long-term goals – Manage biases and stick to risk tolerance – Review and rebalance portfolio periodically |
| Asset Class Risk-Return Profiles | – Equities: Higher long-term returns, more volatility
– Bonds: Lower risk, lower long-term returns – Cash: Very low risk, yields lower than inflation – Real estate: Moderate risk, potential for higher returns – Commodities: High volatility, hedge inflation |
What is Risk and Return?
Risk refers to the degree of uncertainty and potential for loss in an investment. It reflects the likelihood that the actual return on an investment will differ from the expected return. The greater the historic or expected variance between actual and expected returns, the riskier the investment is considered. The Sharpe ratio and Sortino ratio measure this riskiness.
Return is the gain or loss from an investment over a period, typically expressed as a percentage. Returns can come from capital gains or losses and from income, including dividends and interest. Investors aim for higher returns but need to balance this with the risk taken to achieve those returns.
Types of Risks
This diagram lays out the various types of investment risks:
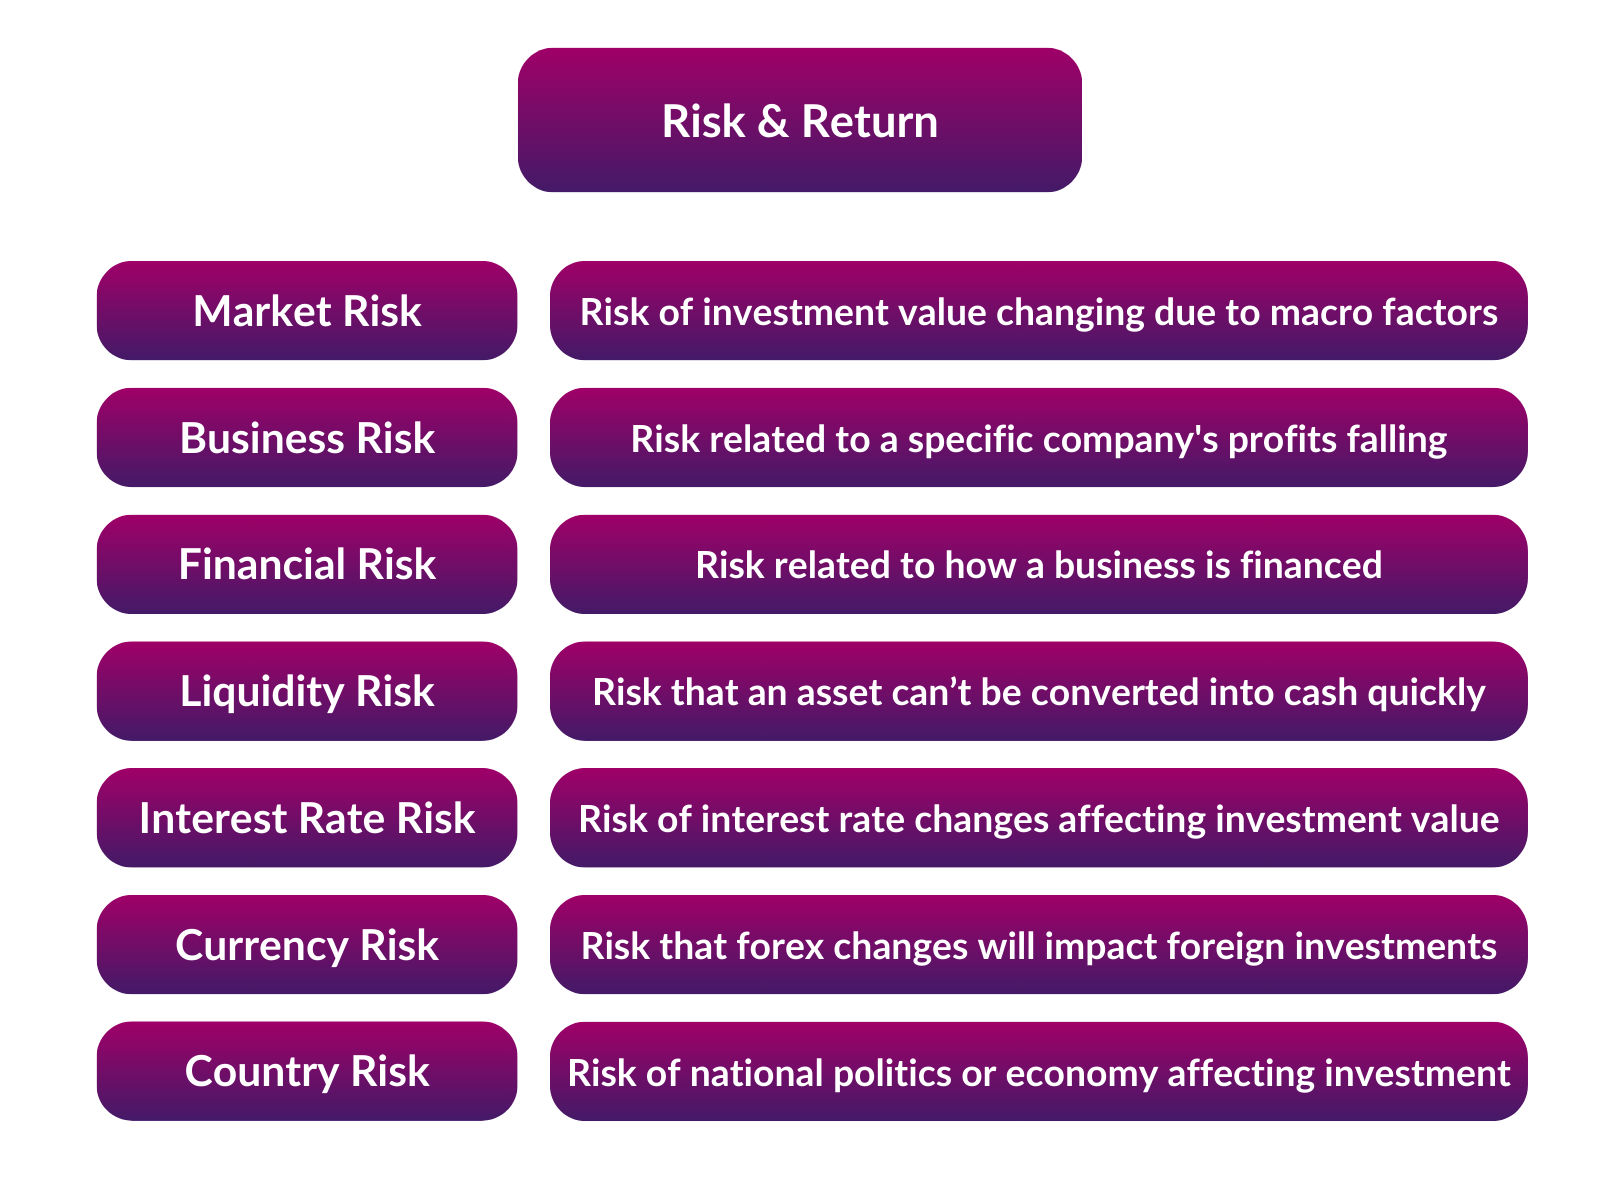
Market Risk
The risk that an investment’s value will change due to macroeconomic factors affecting the overall stock market. We’ve just experienced such a risk event in the early 2020s when a rapid increase in inflation and then interest rates led to a huge change in the returns demanded by investors. In particular fixed income investments performed badly, with broad indices of UK government bonds falling nearly 40% in a year. This happened because investors realised that real future returns from Government bonds, at then current market prices, would be negative as inflation rose. This led to big price falls. Equities were affected in a similar but less dramatic way.
Business Risk
The risk related to a specific company’s profits falling due to changing demand for its products, loss of competitiveness, or other outside factors like regulation.
Financial Risk
The risk related to how a business is financed, including the likelihood of defaulting on debt. Whilst using debt finance potentially raises returns on equity to shareholders, debt gives rise to “fixed charges”, i.e. interest and principal repayments. These put pressure on cashflow and can lead to distress even in an otherwise performing business.
Liquidity Risk
The risk that an asset cannot be converted into cash quickly. This is a very contemporary issue as investors move more to “private markets” where investments are unquoted, don’t have a liquid market and can only reliably be valued when sold.
This can be a problem even in listed investments that trade on a stock exchange. Indeed, it is a perennial problem for investors in Open-Ended Investment Companies (OEICs) that invest in illiquid assets like commercial property. Many such funds had to be “gated” -i.e. investors were stopped from withdrawing their money- as property prices fell during the COVID crisis. The Investment companies could not realise their assets fast enough to give investors their cash. This was one of the main drivers behind the Woodford Patient Capital Fund scandal in the UK. This high-profile fund struggled when investors lost confidence and cashed-out. The fund was left with an increasingly concentrated portfolio of listed but illiquid small company investments.
Interest Rate Risk
The risk that interest rate changes will affect an investment’s value. This often goes hand in hand with inflation. Fixed income securities, like corporate bonds are priced by discounting their cashflows using a Government bond yield, or Swap rate, plus a credit spread. As those yields go up, the value of a bond goes down.
Currency Risk
The risk that exchange rate fluctuations will impact the return on foreign investments. The FTSE 100 companies generate over 75% of their earnings abroad. Changes in the value of sterling will affect their earnings. In dramatic cases, such as Turkey and Argentina, poor economic management in the past has led to dramatic devaluations of the currency destroying the value of investments.
Country Risk
The risk that political or economic conditions of a country will affect investment. If we take the case of Argentina, the country has suffered hyper-inflation, destroying the value of its currency, but worse still, it has been forced to “reschedule” its foreign debts too. This means that investors holding US dollar denominate bonds have not been paid interest for extended periods and then been forced to forgive some overdue interest and exchange their bonds for new securities of much lower face value!
Inflation Risk
The risk that inflation will undermine the returns of an investment.
Measuring Risks and Returns
Investment risk is measured using standard statistical measures:
- Standard deviation – the most common measure of risk, measures the dispersion of actual returns around an average return. A higher standard deviation indicates higher risk. To give a feel for the real-world scale, if we take the S&P500 index, Over the period 2004-2024, it returned an average compound return – dividends reinvested- of 9.8% annually. Over the slightly shorter period from 2009 to 2022, the standard deviation of return was 17.7%. What this means is that in that period, roughly 60% of the time, the annual return fell within the range 9.8%+/-17.7%. That is volatility!
- Beta – it measures an investment’s volatility relative to a market benchmark. A beta higher than 1 indicates that a stock is more volatile than the overall market. Beta data is readily available from investor platforms such as Stockopedia, Sharepad, Bloomberg, CapIQ etc.
- R-squared (the correlation coefficient) – this indicates how much of an investment’s movements can be explained by movements in a benchmark index. An R-squared near 100 percent indicates an almost perfect correlation: the stock or fund almost exactly follows the market up and down. It’s essential to ensure the benchmark is appropriate for the investment being measured.
Risk-adjusted return measures include:
- Sharpe Ratio – a common metric that assesses the performance of an investment by adjusting for its risk. The higher the Sharpe ratio, the better the risk-adjusted performance. The Sharpe ratio or the “reward to variability ratio” as Mr Sharpe dubbed it, is the ratio of the Excess return on an asset to the variability (standard deviation) of the excess return. By “excess return” here we mean the return net of the “Risk free rate,” i.e. the return offered by a “risk free” asset like a Government bond. The ratio for the S+P 500, is around 2.7. That’s a great number. 1-2 is generally considered Good. 2-3 is excellent.
- Sortino Ratio – Similar to the Sharpe ratio but focuses only on the downside risk, instead of dividing by the standard deviation, we divide by the downside deviation. This is like the standard deviation, but we only consider negative variances, positive variances vs. average return are treated as zeroes. This can provide a better view of an investment’s risk during downturns. Upside volatility isn’t a risk, it’s a reward, so only looking at the “bad news” makes sense.
Key return measures include:
- Return on investment (ROI) – net profit from investment divided by the cost of investment.
- Internal rate of return (IRR) – the interest rate at which the net present value of cash flows equals zero.
- Total return – capital gains plus income over a period, shown as a percentage of the initial investment value.
Risk Management Strategies
Investors use various strategies to manage or minimise investment risks:
Diversification
Investing in arrange of investments in an asset class lowers exposure to individual investment risks. Investing in a portfolio of only 6 listed equities will give a portfolio whose return variance is only 10% different from the market. You have eliminated a lot of the “stock specific performance” from your portfolio.
Hedging
Using derivatives contracts to offset potential losses from adverse price movements. The Vix index- which is an index of short-dated equity option prices on the CME is a good indicator of the prices investors are and have been willing to pay for hedging.
Asset Allocation
Strategically dividing investments across various asset classes based on goals and risk tolerance. Modern portfolio theory which was developed by Harry Markovitz in the 1950s is the basis for most asset allocation in large fund managers, using the Sharpe ratio idea.
Using non-linear programming Markowitz took historic returns and variabilities of returns on different asset classes and calculated the mix which would have given the best Sharpe ratio – i.e. the most return compared to the overall portfolio volatility. The “classic” portfolio this gives rise to is the Equity/Bond 60/40 portfolio. This analysis can be done in Excel using Solver. The challenge for a manager is to accurately estimate likely future returns and variabilities to build a portfolio for the future – as opposed to the past. The 60/40 and “lifestyle portfolios” spectacularly failed in 2021. After 30 years of falling bond yields ending in negative returns, the future was never going to be the same as the past. Many large fund managers seemed to have not read chapter two of Mr Markowitz’ book!
Ongoing Portfolio Monitoring and Rebalancing
Portfolio rebalancing to maintain target asset allocations and risk exposures is an interesting and counterintuitive apparoch. For example, a manager with a target 60/40 allocation will periodically rebalance: a strong year for equities might leave the portfolio at the end of the year at 63/37. The conventional approach is to sell equities and invest in bonds to get back to 60/40. Extensive research shows that over time this approach enhances returns as the manager tends to be selling more expensive assets to buy the cheaper assets.
Other risk management techniques include:
- Incorporating sophisticated risk measures such as Conditional Value at Risk (CVaR) for a more comprehensive risk assessment.
- Investing in “safe” assets like bonds and cash to balance riskier investments in stocks.
- Limiting position sizes and avoiding overexposure to particular assets or markets.
Impact of Risk and Return in Investment Decision Making
Balancing risk and return is key in financial decision-making. Investors should aim for maximum returns for a given level of risk. Key principles for risk-return optimisation include:
- No risk, no return – higher-yielding investments generally involve more risk.
- Focus on total return at the portfolio level rather than individual assets.
- Diversify across asset classes and markets to reduce overall portfolio risk.
- Take on smart risks – consider higher-risk assets like stocks for long-term goals.
- Manage emotional biases and stick to pre-defined risk tolerance levels. Most amateur portfolio managers make standard mistakes, such as home market bias, over-concentration, not enforcing limits and so on.
- Review the portfolio periodically for risk exposures and rebalance when needed.
- Embrace technological advancements, perhaps the biggest boon to small investors is the availability of cheap funds through retail platforms allowing investors to diversify internationally and by asset class at low cost.
Risk and Return in Different Investment Avenues
Risk and return profiles differ across various asset classes:
- Equities – Higher long-term returns but more volatility and higher risk than other assets.
- Bonds – Lower risk than equities but also lower expected returns over the long term.
- Cash equivalents – Very low risk but yields are lower than inflation over the long term.
- Real estate – Moderate risk, potential for higher returns than bonds over time.
- Commodities – High volatility but can be used to hedge inflation risk.
Within equities, stable “value” stocks are considered lower risk than higher-growth stocks. Risk and return also vary significantly across different markets and geographic regions.
Risk Management Examples & Exercises
Here are some examples to demonstrate risk measurement and management techniques:
Example 1:
An investor has a $100,000 portfolio with 50% in stocks (beta 1.2), 30% in bonds (beta 0.5) and 20% in cash (beta 0). What is the portfolio’s beta if the market benchmark beta is 1.0?
Portfolio Beta = (0.5 x 1.2) + (0.3 x 0.5) + (0.2 x 0) = 0.75
Example 2:
An equity fund has average returns of 15% over the past 5 years. Its standard deviation is 9% while the market standard deviation is 12%. What is the fund’s Sharpe ratio if the risk-free rate is 4%?
Sharpe Ratio = (Return – Risk-free rate) / Standard Deviation
= (0.15 – 0.04) / 0.09 = 1.22
Example 3:
An investor has a $100,000 portfolio allocated 60% to equities, 30% to bonds and 10% to cash. If equities lose 20%, bonds lose 5% and cash stays stable in a crisis, what is the portfolio’s total loss?
Equities loss = 0.6 x $100,000 x 20% = $12,000
Bonds loss = 0.3 x $100,000 x 5% = $1,500
Total loss = $12,000 + $1,500 = $13,500
So total portfolio loss = $13,500 or 13.5% of initial $100,000 value.
This illustrates the risk minimizing benefits of diversification and fixed income assets.
Analysing investment returns and risks is crucial for making informed financial decisions. By quantifying and balancing risk and return trade-offs across a diversified portfolio, investors can work towards optimising profits while maintaining acceptable risk parameters aligned with their objectives.
")

An experienced finance and training professional and Co-Founder of Capital City Training Ltd, Greg has a demonstrated history of working in the financial services sector and has a passion for sharing his knowledge and skills throughout the financial services sector. He has been partnering financial and corporate clients in designing and delivering applied financial programs that make an impact on business outcomes. Greg is skilled in accounting & financial analysis, derivatives and risk management, financial modelling, business valuation and corporate finance and has worked with the worlds leading financial institutions. A strong business development professional and a qualified accountant (ICAEW member), CFA Charterholder and Associate Member of the Association of Corporate Treasurers in the UK (ACT).