Year-over-Year (YOY): Definitions, Formulas, and Examples
Understanding year-over-year (YOY) growth is a fundamental skill for graduates entering corporate finance roles. Comparing period-over-period performance provides insight into the financial health and trajectory of a business.
Article Contents
Key Takeaways
| Takeaway | Description |
|---|---|
| YOY growth compares performance over time | Calculates % change in financial metrics compared to prior year period to assess performance trends |
| Simple formula | (Current Period – Prior Period)/Prior Period. Can also calculate as Current Period/Prior Period – 1 |
| Useful analysis tool | Helps evaluate revenue growth, profitability, expenses to measure business health |
| Addresses seasonality | Compares same period across years to filter out seasonal fluctuations |
| Potential limitations | Base effect when initial period has small value; use with other metrics |
| Real-world applications | Compare revenue, costs, profitability, benchmarking, identify cost drivers, inform decisions |

What is Year-Over-Year Growth?
Year-over-year (YOY) growth is a way of calculating the percentage change in a financial metric compared to the same period the previous year. For example, if a company’s revenue was $1 million in Q4 2021 and $1.1 million in Q4 2022, the YOY revenue growth would be 10%.
YOY growth metrics are useful for corporate finance professionals to track performance over time and compare current results to historical periods. It helps answer questions like – are we growing revenue, increasing profitability, or reducing expenses compared to last year? Assessing YOY growth trends is an important part of financial analysis and evaluating the health of a business.
Formula for Calculating YOY Growth
The formula for YOY growth calculations is straightforward:
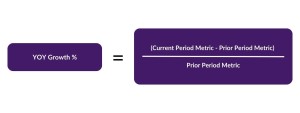
YOY Growth % = (Current Period Metric – Prior Period Metric) / Prior Period Metric
Or, alternatively
YOY Growth % = (Current Period metric / Prior Period Metric) -1
Where:
- Current Period Metric = The financial metric you’re measuring for the current period (e.g., revenue for Q4 2022)
- Prior Period Metric = The same financial metric for the comparable prior period (e.g., revenue for Q4 2021)
For example, to calculate YOY revenue growth:
- Current Period Revenue = $1.1 million (Q4 2022)
- Prior Period Revenue = $1 million (Q4 2021)
- YOY Growth % = ($1.1 million – $1 million) / $1 million = 0.1 or 10%
Using the alternative method: YOY Growth = ($1.1m / 1m) – 1 = 0.10 or 10%
This formula can be applied using any financial metric like net income, expenses, earnings per share, etc. The key is to use the same metric for both the current and prior period, allowing for an apples-to-apples comparison.
Calculating YOY Growth in Excel
Excel provides a simple way to set up the calculations for YOY growth:
The current and prior period metric cells can be linked to data from other sheets or tables.
For example:
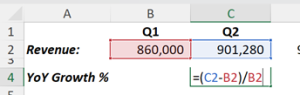
Excel tip: Remember for format the YoY cells as percentages! A short cut for formatting as a % is Ctrl+Shift+5 (where shift 5 is the “%” symbol on your keyboard!
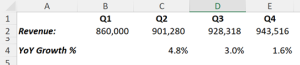
This provides an automated YOY growth calculation that will update if the source data changes, which is useful for quickly assessing trends across multiple metrics or periods.
The result:
Addressing Seasonality with YOY Growth
YOY growth can address seasonality in businesses. By comparing specific months or quarters from one year to the next, stakeholders can obtain a clearer view of a company’s performance, filtering out seasonal fluctuations that might distort month-over-month or quarter-over-quarter comparisons.
Potential Limitations of YOY Growth
While YOY growth is a valuable metric, its limitations include the “base effect,” which occurs when the initial value (base) is small. A relatively small increase in the metric can result in a large YOY growth percentage. Therefore, it’s essential to use YOY growth in conjunction with other financial metrics to obtain a holistic view of a company’s performance.
Real World Exercises and Examples for Year-Over-Year Growth
Let’s look at some practical examples of how corporate finance professionals might use YOY growth in their analysis:
- Compare revenue growth – If Q1 2021 revenue was $5M and Q1 2022 was $6M, the YOY growth is (6M – 5M)/5M = 20%
- Evaluate marketing spend – If marketing expenses were $50K in Q3 2020 and $55K in Q3 2021, the YOY growth is (55K – 50K)/50K = 10%
- Analyse regional sales – If North America revenue grew from $10M in 2018 to $12M in 2019, the YOY growth is (12M – 10M)/10M = 20%
- Assess product line profitability – If Product A net income declined from $1M in 2017 to $800K in 2018, its YOY change is (800K – 1M)/1M = -20%
- Benchmark against competitors – If Company X’s YOY revenue growth was 15% and Company Y’s was 10%, Company X outpaced competitors.
- Identify cost drivers – If R&D spending increased 30% YOY, analyse what’s driving the growth.
Calculating and comparing YOY growth rates helps reveal trends, identify high/low performers, and inform strategic decisions. Regular YOY analysis is critical for corporate finance roles.
To find out more about calculating YoY growth in corporate finance and for different industries and clients, take our accounting and analysis elearning course.


Former banker turned entrepreneur. I successfully restructured, purchased, managed and sold a private engineering group, Steel Line Ltd, through an LBO and was also an equity partner in Corporate Training Group which my partners and I successfully sold to the AIM listed ILX group in 2006. I established Capital City Training Limited in early 2010 with my business partner Greg. We acquired MS Consultants a few years ago (so I’m still doing a bit of M&A). I have had non-exec roles for a small and growing VA/recruitment business and a fast-growing beverage logistics company. I am also an active investor.
Capital City Training is a full service technical and management development training company focused on the banking, wealth management and broader financial services and accounting industries. Having said all that, in the last couple of years we’ve been branching out into training for non-financial companies – manufacturing, retail, tech, defense.. so old and new economy. We also provide consultancy around modelling and are currently working for a leading PPP/PFI advisory firm. We have delivered training in every continent of the world in 2024… except Antarctica. Perhaps in 2025?! Watch this space.
Capital’s dedicated faculty combine extensive line experience as corporate financiers, bankers, traders, portfolio managers and equity analysts together with over 60 years of experience in learning and development as both procurers and providers of tailored in-house training, eLearning and blended learning. Our faculty also includes experienced Management development training specialists allowing us to provide HR consultancy services, management development training and also innovative integrated management development & technical training events. Capital City’s faculty embody over 100 years of line experience across the fields of accounting, corporate finance, derivatives, credit, lending, investment, equity research transaction banking and origination.