Debt-to-Equity Ratio: Formula, Analysis and Examples
The debt-to-equity ratio is one of the most frequently cited metrics in financial analysis, yet it’s also one of the most misunderstood. While it appears straightforward—a simple measure of how much debt a company carries relative to shareholder equity—the reality is far more nuanced.
This guide explains what the ratio actually measures and why it matters for assessing financial risk. You’ll learn how to calculate it properly and why definitions of ‘debt‘ vary between analysts. We’ll explore why context—industry, growth stage, and capital structure—determines what’s ‘healthy’ and examine the limitations that even experienced analysts sometimes overlook.
Article Contents
Key Takeaways
| Key Points | Details |
|---|---|
| Debt-to-Equity Measures Leverage | The ratio compares total debt to shareholders’ equity, indicating how much a company relies on borrowed funds versus its own capital. |
| Definition of Debt Varies | Some analysts use total liabilities, while others focus only on interest-bearing debt, which can significantly change the result. |
| Leverage Amplifies Returns and Risk | Debt can enhance returns when performance is strong but increases downside risk due to fixed repayment obligations. |
| Context Determines What Is Healthy | An appropriate ratio depends on industry, business model, and company growth stage rather than a universal benchmark. |
| Industry Differences Matter | Capital-intensive sectors often sustain higher ratios, while asset-light businesses typically operate with lower leverage. |
| Cash Flow Is Critical | The ratio ignores cash generation, so strong or weak cash flow can materially change the true risk assessment. |
| Limitations in Balance Sheet Data | Timing effects, book value equity, and temporary debt changes can distort how representative the ratio is. |
| Best Used With Other Metrics | Debt-to-equity should be analysed alongside coverage ratios, liquidity metrics, and trend comparisons for a complete view. |
What Is the Debt-to-Equity Ratio?
The debt-to-equity ratio measures financial leverage by comparing a company’s total debt to its shareholders’ equity. It reveals how much external financing a company uses relative to the capital provided by shareholders. A ratio of 1.5, for instance, indicates that for every £1 of equity, the company carries £1.50 of debt.
This metric serves as a fundamental indicator of capital structure and financial risk. Companies with higher ratios rely more heavily on borrowed funds, which amplifies both potential returns and risks. The ratio helps analysts assess whether a company’s debt load is sustainable given its equity base and whether it has additional debt capacity for future financing needs.
Leverage
Financial leverage isn’t inherently good or bad—it depends on the company’s ability to generate returns that exceed the cost of debt. When a company earns more on borrowed capital than it pays in interest expense, leverage enhances return on equity. (We see a numerical illustration of the Impact of Leverage further on in this article.)
So why not just borrow even more, and enhance (leverage) the returns to you? Well, we know debt creates fixed obligations that must be met regardless of business performance, increasing financial risk during downturns. For this reason, banks and other debt providers will only be willing to lend up to a limit – depending on the nature of the business, market conditions, interest costs and, as with a house, the safety / security in the assets being funded. This is why Debt/Equity is a useful metric and often given as a lending limit by banks.
Formula to Calculate Debt-to-Equity Ratio
The basic formula is:
Debt-to-Equity Ratio = Total Debt ÷ Total Shareholders’ Equity
The problem is that ‘debt’ means different things to different analysts. Some use total liabilities, which includes all obligations: from trade payables to pension obligations. Others restrict the definition to interest-bearing debt only—bank loans, bonds, and similar financial obligations that carry explicit interest costs.
The distinction matters considerably. A retailer with substantial trade payables might show a high ratio using total liabilities, yet face minimal financial risk if those payables are simply part of normal operating cycles. Conversely, focusing solely on interest-bearing debt provides a clearer picture of financial leverage and the company’s exposure to interest rate changes and refinancing risk.
In practice, most financial analysts prefer interest-bearing debt for leverage analysis, as it better reflects the capital stack and the company’s true financial obligations. However, when comparing companies or reviewing published ratios, always verify which definition is being used. The difference can be substantial, particularly for companies with significant operating liabilities.
How to Calculate Debt-to-Equity Ratio in Excel
Calculating the debt-to-equity ratio in Excel requires extracting the correct figures from a company’s balance sheet and applying the formula systematically.
Step-by-Step Calculation
Start by locating the balance sheet in the company’s financial statements. Shareholders’ equity typically appears as a single line item at the bottom of the liabilities and equity section. It represents the residual interest in assets after deducting liabilities—essentially what belongs to shareholders.
For debt, you’ll need to make a choice. If using total liabilities, simply reference that line item. For interest-bearing debt only, sum
the relevant components: short-term borrowings, current portion of long-term debt, and long-term debt. Some analysts also include capital leases or finance leases, as these represent debt-like obligations.
Here’s an illustration with the balance sheet transferred into Excel:
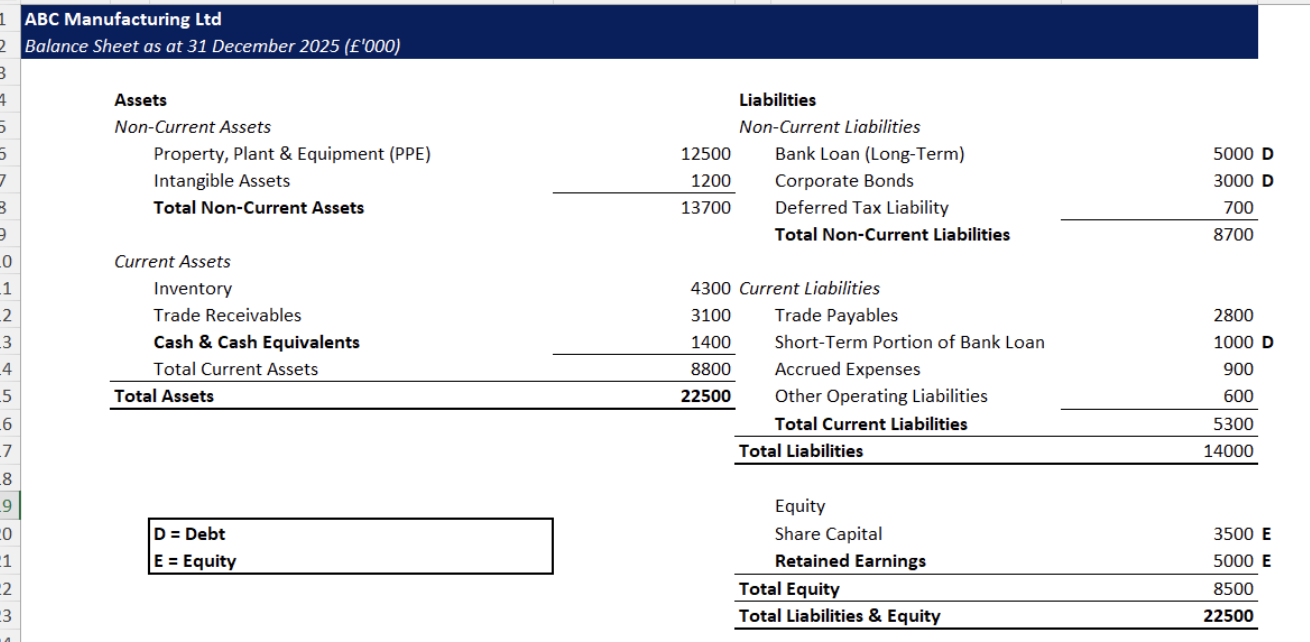
The ‘regular’ D/D ratio is:
=(G6+G7+ G13) / (G20+G21) = 9,000/8,500 = 1.06
Is this high? Low? Average? It has to be put into context and both:
- Compared across time for the same company
- Compared against other similar companies (industry, geography, size, operating model etc.
When working with multiple periods or companies, create a table with debt and equity in columns and periods or company names in rows. This allows you to calculate ratios across time or perform peer comparisons efficiently.
One practical consideration: some companies report negative shareholders’ equity, particularly after significant losses or share buybacks. In such cases, the debt-to-equity ratio becomes meaningless or negative. This signals severe financial distress and requires alternative metrics like debt-to-assets or enterprise value analysis.
How Debt-to-Equity Ratio Affects a Company’s Risk Profile
The relationship between leverage and risk forms the core of capital structure decisions. Understanding this trade-off is essential for assessing whether a company’s debt load is appropriate or concerning.
The Trade-Off: Leverage vs Risk
Debt is leverage—it amplifies returns when business conditions are favourable. Consider a company with £100 million in equity generating £10 million in operating profit. If entirely equity-financed, return on equity is 10%. Now suppose the company was funded 50/50 debt and equity. Interest cost being 5%. As shown below, the Return on Equity is enhanced to 15%. But also, look what happens to the RoE if profits rise 10%, or fall 10% – the impact on returns is amplified.
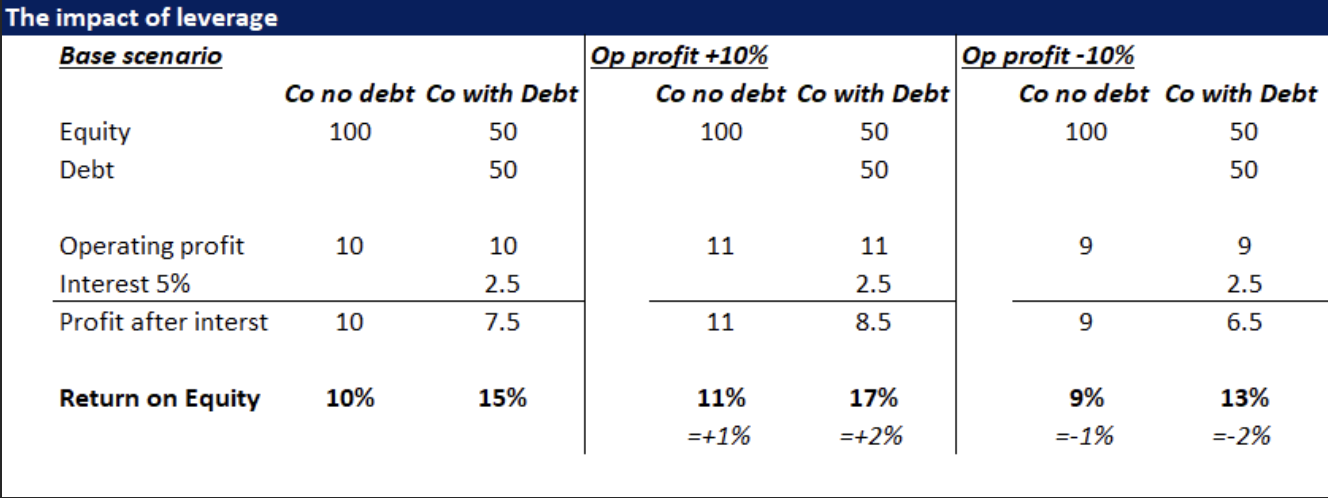
The problem is that leverage works both ways. This asymmetry creates financial risk—the possibility that debt obligations cannot be met from operating cash flows, and the additional ‘hit’ to equity investors in a downturn.
High leverage also affects debt service coverage ratio, which measures how comfortably a company can meet interest payments from earnings. A company with substantial debt relative to equity typically shows lower coverage ratios, leaving less margin for error if revenues decline. Bond ratings reflect this risk, with highly leveraged companies receiving lower ratings and facing higher borrowing costs.
The concept of optimal capital structure recognises that some debt is beneficial—interest is tax deductible, reducing the effective cost of borrowing—but excessive debt increases bankruptcy risk and constrains operational flexibility. The optimal point varies by company, depending on cash flow stability, asset tangibility, and growth opportunities.
What Is Considered a Healthy Debt-to-Equity Ratio?
There’s no universal answer to what constitutes a healthy debt-to-equity ratio. The optimal level depends heavily on industry characteristics, business model, and growth stage.
Industry Benchmarks and Growth Stage Considerations
Capital-intensive industries naturally carry higher debt-to-equity ratios. Utilities, telecommunications companies, and infrastructure businesses often show ratios above 1.5 or even 2.0. These companies own substantial tangible assets that serve as collateral, generate predictable cash flows, and require significant upfront investment that makes debt financing attractive.
Conversely, technology companies, professional services firms, and other asset-light businesses typically maintain lower ratios, often below 0.5. These companies rely on intangible assets and human capital, which provide poor collateral for lenders. Their cash flows may be less predictable, and they often prefer equity financing to maintain financial flexibility for research and development or acquisitions.
For startups and high-growth companies, low debt-to-equity ratios are common and often preferable. Early-stage businesses typically lack the stable cash flows needed to service debt comfortably. Venture capital and equity financing dominate their capital structure, resulting in ratios near zero. As companies mature and cash flows stabilise, they may gradually increase leverage to optimise their capital structure and reduce the cost of capital.
Debt capacity—the amount of debt a company can reasonably support—depends on cash generation, asset quality, and market conditions. A company with strong, recurring revenues and high margins can sustain more debt than one with volatile earnings. Bond ratings provide external validation of debt capacity, with investment-grade companies typically maintaining ratios that rating agencies consider sustainable for their industry and business model.
Focusing on a single ‘ideal’ ratio misses the point. A ratio of 0.8 might be conservative for a utility but aggressive for a software company. The question isn’t whether the ratio is high or low in absolute terms, but whether it’s appropriate given the company’s specific circumstances and whether management has demonstrated the ability to manage leverage effectively through business cycles.
What the Ratio Doesn’t Tell You
The most critical limitation is that the ratio ignores cash flow entirely. A company might show a high debt-to-equity ratio yet generate substantial operating cash flow that comfortably covers debt service. Conversely, a company with a modest ratio but weak cash generation might struggle to meet obligations. The debt service coverage ratio—which compares operating income to interest expense—provides essential context that the debt-to-equity ratio cannot.
Book value versus market value creates another significant issue. Shareholders’ equity on the balance sheet reflects historical costs and accounting conventions, not economic reality. For asset-light businesses with valuable intangible assets—brands, patents, customer relationships—book equity substantially understates true equity value. A software company might show high leverage based on book values whilst being conservatively financed in economic terms.
The ratio also suffers from timing issues. Balance sheets represent a single point in time, typically quarter-end or year-end. Companies often manage their balance sheets around reporting dates, paying down debt temporarily or timing equity raises to present favourable ratios. More importantly, the ratio doesn’t reflect upcoming debt maturities or refinancing risk. A company might appear adequately leveraged today but face a cash firehose of maturing debt next year.
People forget that the ratio treats all debt equally, regardless of terms, covenants, or maturity profile. A company with £100 million in long-term, fixed-rate debt at favourable terms faces very different risks than one with £100 million in short-term, floating-rate debt with restrictive covenants. The debt-to-equity ratio captures none of these distinctions.
Additionally, the metric provides no information about liquidity. The current ratio and other short-term solvency measures are essential complements. A company might have a reasonable debt-to-equity ratio but insufficient liquid assets to meet near-term obligations, creating immediate financial distress despite acceptable long-term leverage.
Is this actually useful? Yes, but only as part of a broader analysis. The debt-to-equity ratio serves as a starting point for understanding capital structure, not a definitive assessment of financial health. Experienced analysts use it alongside cash flow metrics, coverage ratios, and qualitative factors like management quality and competitive position.
Common Interview Questions on Debt-to-Equity Ratio
Understanding how to discuss the debt-to-equity ratio in interviews demonstrates both technical knowledge and practical judgement—qualities that banks and financial institutions value highly.
Sample Questions and How to Answer Them
Why might two companies in the same industry have vastly different debt-to-equity ratios?
Strong answers acknowledge multiple factors. Business model differences matter—a company with long-term contracts and predictable revenues can support more leverage than one with volatile, project-based income. Management philosophy varies considerably; some leadership teams prefer conservative capital structures whilst others pursue aggressive growth through leverage. Growth stage is relevant—mature companies often carry more debt than rapidly expanding competitors that rely on equity financing. Company-specific factors like asset quality, credit rating, and access to capital markets also influence optimal leverage levels. The best responses avoid suggesting one approach is universally superior, recognising that different strategies can be appropriate depending on circumstances.
How would you assess whether a company’s debt-to-equity ratio is sustainable?
Effective answers move beyond the ratio itself to examine underlying fundamentals. Start by analysing cash flow generation and debt service coverage—can the company comfortably meet interest and principal payments from operations? Consider the debt maturity profile and refinancing risk. Evaluate the ratio relative to industry peers and historical norms for the company. Examine trends—is leverage increasing or decreasing, and why? Assess the quality of assets backing the debt and the company’s access to capital markets. Strong candidates mention that sustainability depends on business cycle position; a ratio that’s sustainable during expansion might become problematic during recession.
What other metrics would you use alongside debt-to-equity to evaluate financial health
Comprehensive answers demonstrate breadth of knowledge. Interest coverage ratio shows how easily a company can meet interest obligations from operating earnings. Debt-to-EBITDA provides a cash flow-based perspective on leverage. The current ratio and quick ratio assess short-term liquidity. Free cash flow indicates the company’s ability to service debt whilst funding operations and growth. Return on equity helps evaluate whether leverage is enhancing shareholder returns. Enterprise value and the capital stack provide market-based perspectives on how investors view the company’s financial structure. The strongest responses explain why each metric addresses specific limitations of the debt-to-equity ratio, creating a more complete picture of financial health.
When answering interview questions, avoid absolute statements. Phrases like it depends or in practice signal sophisticated thinking. Acknowledge that financial analysis requires judgement, not just calculation. Demonstrate awareness that metrics like debt-to-equity are tools for understanding, not definitive answers. This approach shows the analytical maturity that interviewers seek in candidates for roles in commercial and investment banking, fund management, and corporate finance.


Former banker turned entrepreneur. I successfully restructured, purchased, managed and sold a private engineering group, Steel Line Ltd, through an LBO and was also an equity partner in Corporate Training Group which my partners and I successfully sold to the AIM listed ILX group in 2006. I established Capital City Training Limited in early 2010 with my business partner Greg. We acquired MS Consultants a few years ago (so I’m still doing a bit of M&A). I have had non-exec roles for a small and growing VA/recruitment business and a fast-growing beverage logistics company. I am also an active investor.
Capital City Training is a full service technical and management development training company focused on the banking, wealth management and broader financial services and accounting industries. Having said all that, in the last couple of years we’ve been branching out into training for non-financial companies – manufacturing, retail, tech, defense.. so old and new economy. We also provide consultancy around modelling and are currently working for a leading PPP/PFI advisory firm. We have delivered training in every continent of the world in 2024… except Antarctica. Perhaps in 2025?! Watch this space.
Capital’s dedicated faculty combine extensive line experience as corporate financiers, bankers, traders, portfolio managers and equity analysts together with over 60 years of experience in learning and development as both procurers and providers of tailored in-house training, eLearning and blended learning. Our faculty also includes experienced Management development training specialists allowing us to provide HR consultancy services, management development training and also innovative integrated management development & technical training events. Capital City’s faculty embody over 100 years of line experience across the fields of accounting, corporate finance, derivatives, credit, lending, investment, equity research transaction banking and origination.