Return on Equity (ROE): Definition, Formula and Examples
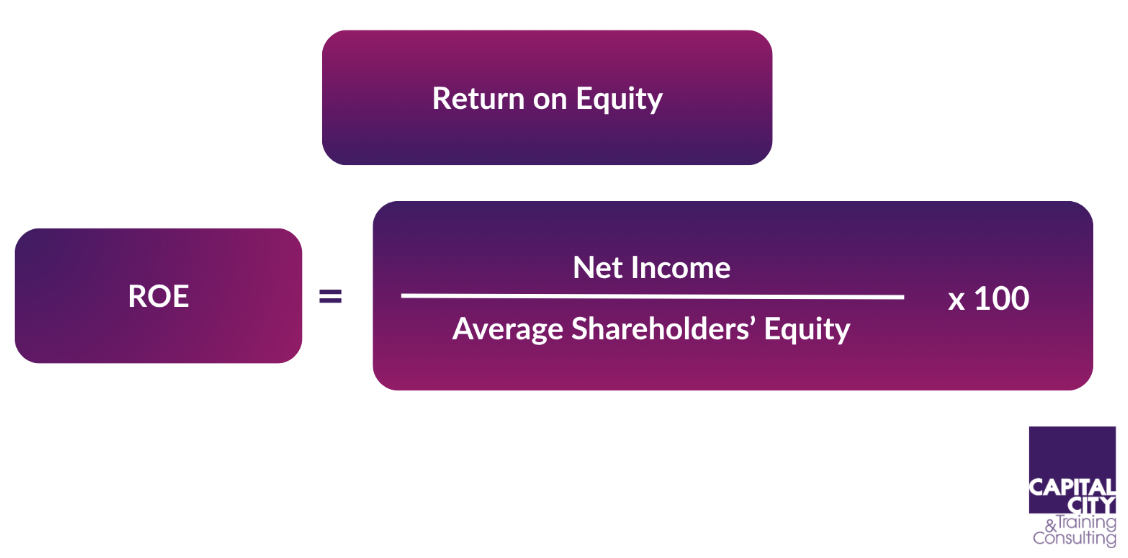
Return on equity is a measure of a company’s profitability in relation to its shareholders’ equity investment. It represents net income (profit after interest and tax) as a percentage of shareholders’ equity. It’s as simple as that to compute, but it is by no means the same as the % return an equity investor would by buying shares in a company!
ROE as a measure is particularly valuable because it shows how effectively (and efficiently) management is using shareholders’ investments to create profits. A higher ROE typically indicates better efficiency in utilizing shareholders’ capital, though this needs to be considered alongside other financial metrics for a comprehensive analysis – especially some kind of leverage (debt) measure. ROE can be enhanced through the use of debt, but with this comes financial risk.
Article Contents
- How to Calculate ROE: Step-by-Step Guide?
- Understanding Return on Tangible Equity (ROTE)
- What is a Good ROE? Benchmarks and Industry Standards
- ROE Analysis with the DuPont Formula
- Common Pitfalls in Using ROE
- Return on Equity Case Studies and Examples
- Common Interview Questions regarding Return on Equity
- Practical Applications and Industry Insights
- FAQs
Key Takeaways
| Key Point | Details |
| Definition of ROE | Measures a company’s profitability in relation to its shareholders’ equity invested in that company. |
| ROE Formula |
|
| Purpose of ROE | Evaluates management’s effectiveness in utilising shareholders’ investments to create profits. |
| How to Calculate ROE |
|
| Understanding ROTE | This is the return on Tangible equity – commonly used in financial institution analysis – and simply excludes intangible assets (goodwill, patents, trademarks) to offer a purer (and more generous, but realistic) profitability measure on the real working assets. |
| Good ROE Benchmarks | Varies by industry:
|
| DuPont Analysis | This is a ‘breakdown’ of ROE into sub-components to give deeper insight to ROE. The simplest form is to break ROE into:
|
| Common ROE Pitfalls |
|
| Case Studies |
|
How to Calculate ROE: Step-by-Step Guide
- Gather Financial Information
- Obtain the company’s net income from the income statement
- Find the shareholders’ equity from the balance sheet
- Consider using average shareholders’ equity for more accurate results
- Calculate Average Shareholders’ Equity
- Add beginning and ending shareholders’ equity
- Divide by 2 to get the average
- Apply the Formula
- ROE = Net Income / Average Shareholders’ Equity × 100
- Interpret Results
- Compare with industry averages
- Analyse historical trends
- Consider other financial metrics
Understanding Return on Tangible Equity (ROTE)
Return on tangible equity represents a more conservative (favourable) measure than traditional ROE. ROTE excludes intangible assets such as goodwill, patents, and trademarks from the equity calculation. The formula is:
ROTE = Net Income / (Shareholders’ Equity – Intangible Assets) × 100
Why ROTE?
- Removes distortion from accounting goodwill
- When a company acquires another, it books goodwill (the premium paid above net assets).
- This goodwill inflates equity, but it doesn’t generate any direct income.
- Using ROE would make returns look artificially low just because of acquisition accounting.
- ROTE strips out this “dead weight” and gives a better view of performance of the core, tangible capital that actually earns returns.
- Better comparability across firms
- Companies that look similar in size may have very different balance sheets due to one having grown through acquisition (rather than organically). This puts a big Goodwill number on the balance sheet which can distort (for comparability) the ROE.
- ROTE lets analysts compare profitability without being skewed by past M&A.
- Regulatory alignment (for financials)
- Regulators like the ECB and PRA often focus on tangible common equity and tangible book value in capital adequacy discussions.
- ROTE therefore aligns better with how capital is managed and stress tested.
This metric is particularly relevant for:
- Companies with significant intangible assets
- Industries where tangible assets are crucial
- Comparing companies with different levels of intangible assets
What is a Good ROE? Benchmarks and Industry Standards
In short, if the ROE is greater than the cost of equity then this is interpreted as ‘value-accretive.’ A model such as CAPM might be used to determine a fair Cost of Equity.
Even with this in mind, analysts will want to compare ROE of companies within sectors to see which are stronger / weaker. What is a good return on equity varies significantly across industries and market conditions. Generally:
- 15-20% is considered good in many industries
- Banks typically target ROE of 12-15%. Even though their core profit margins are low, the extreme use of leverage magnifies the ROE to
- healthy levels.
- Technology companies might have higher ROEs due to asset-light business models
- Utility companies often have lower ROEs (6-10%) due to high capital requirements
Factors affecting ROE benchmarks:
- Industry characteristics (the amount of capital intensity)
- Economic conditions (affecting profits in economic swings and micro-economic competitive positioning)
- Company growth stage (ROE can start lower for young companies with significant up-front capital investment and profits coming through at a later stage)
- Risk profile (volatility of the ROE)
- Capital structure (leverage is used to enhance ROE, so companies with the same business model can have very different ROE with the use of debt).
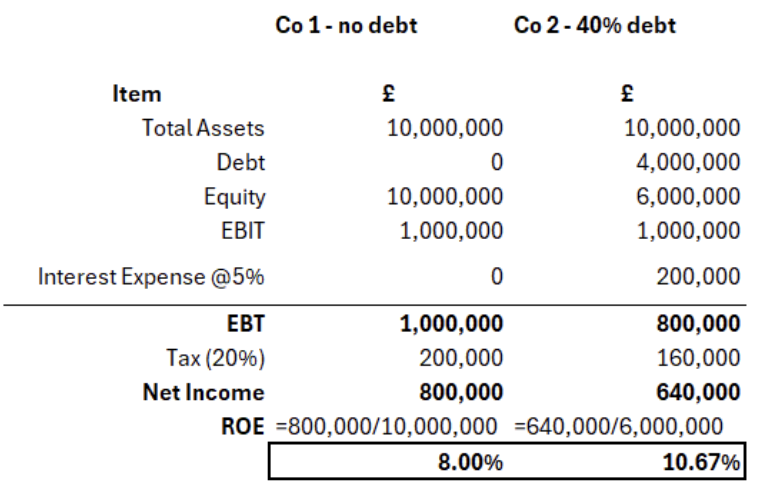
Worked Example of Unlevered vs Levered Company
Take this as evidence of the effect of leverage! Say you had two identical companies, one with no debt and one with 40% Debt / Total Capital, costing 5% interest.
ROE Analysis with the DuPont Formula
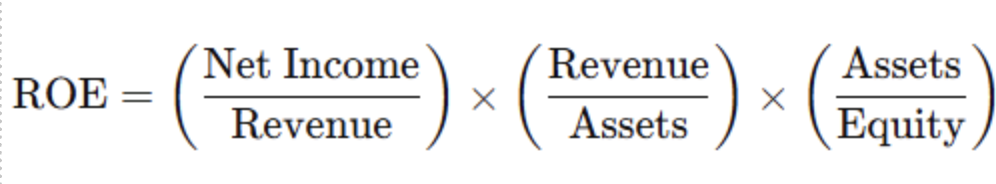
The DuPont Formula breaks down ROE into three components:
ROE = Net Profit Margin × Asset Turnover × Financial Leverage
Where:
Net Profit Margin = Net Income / Sales
Asset Turnover = Sales / Total Assets
Financial Leverage = Total Assets / Shareholders’ Equity
So, multiplying the three ratios together results in ROE:
This analysis helps identify whether a company’s ROE is driven by:
- How profitable is the company? Profit (NI) margin.
- How efficiently does it utilise its assets? Asset Turnover
- How effectively does it use debt in the business funding? Financial leverage (or “gearing”)
Common Pitfalls in Using ROE
When analysing ROE, be aware of these potential issues:
- High Leverage
- Artificially inflated ROE through excessive debt
- Increased financial risk
- One-time Events
- non-recurring items affecting net income
- Extraordinary gains or losses
- Accounting Differences
- Various accounting methods affecting calculations
- International reporting standards variations
- Industry Specifics
- Different capital requirements across sectors
- Varying business models
“
Return on Equity Case Studies and Examples
Case Study 1: Retail Company
- Initial ROE: 8%
- Implementation of efficiency measures
- Reduction in operating costs
- Final ROE: 15%
Lessons learned: Operational improvements can significantly impact ROE
Case Study 2: Technology Firm
- High ROE: 25%
- Asset-light business model
- Strong intellectual property
- Limited physical assets
Key takeaway: Business model influences ROE expectations
Common Interview Questions regarding Return on Equity
- “What factors can improve a company’s ROE?”
Answer: Use the Dupont framework to structure a response! – Increasing profit margins (cost efficiencies), improving asset turnover (using spare capacity in growth), optimizing capital structure (using the right amount of debt – not too little, not too much!) - “How does ROE relate to other financial metrics?”
Answer: ROE complements metrics like ROA, ROCE, and profit margins for comprehensive analysis. Return on assets / capital employed measure returns to ALL investors as a whole, whereas ROE focuses on equity returns. - “Why might a high ROE not always be positive?”
Answer: High ROE might indicate excessive leverage or unsustainable practices - “How does industry affect ROE interpretation?”
Answer: Different industries have varying capital requirements and business models, affecting ROE expectations. Eg IT / service companies with low capital investments vs industrials with capital intensity.
Practical Applications and Industry Insights
ROE serves various practical purposes:
- Investment Analysis
- Comparing companies within sectors
- Evaluating management efficiency
- Assessing investment opportunities
- Corporate Strategy
- Setting performance targets
- Evaluating business units
- Making capital allocation decisions
- Executive Compensation
- Setting performance metrics
- Aligning management with shareholder interests
Return on equity remains a core metric in financial analysis, though its interpretation requires careful consideration of various factors. Understanding both its strengths and limitations enables better financial decision-making and company analysis.