Momentum Investing and the Market Momentum Tracker
At Capital City Training, we’ve been looking into the concept of momentum investing, its history, practice and whether it actually works or not!
With momentum investing, the idea is simple: buy what has performed well, then hold it until it stops performing. One the most well-known research papers in the practice, Returns to Buying Winners and Selling Losers: Implications for Stock Market Efficiency by Jegadeesh and Titman, looks at performance history and examines how long a period of growth should we look for – its momentum – before following it to make money. The next question of obvious import, is how long should we stay invested for before momentum runs out or reverses? The key results from J&T suggest that nine months of performance will typically be followed by a further six months of good performance.
Does Momentum Investing work?
Momentum investing has had a lot of research coverage, which broadly says that momentum investing works. From our experience, we have run momentum portfolios in the past quite successfully, but never with a “control investment” to benchmark against – we just looked at absolute returns.
So, we thought – why not run our own experiment in momentum investing?
Putting Momentum Investing to the Test
There are retail services that provide you with momentum data – like the Salty Dog investor platform that we’ve written about before.
The idea of momentum is that it persists. Markets overshoot – in both directions. As such, we decided to assemble a series of momentum portfolios, with data over 12 months and compare its performance with the MSCI World index.
Our monitor looks at over eight hundred funds available to retail investors in the UK and shows which sectors are performing best and critically which sectors are seeing improving performance – i.e. developing momentum.
Why bother? There are momentum factor funds!
Before we start making up portfolios using this idea, you might ask exactly that question: why bother? “Momentum-factor” indices exist and are investable. Why not just do that?
We benchmarked our portfolio performance against the MSCI world index. If we look at the momentum factor version of this, you will see that it is a variation on a theme, changing the weights of individual stocks, rather than picking completely different stocks in a focused way. The key word also is factor, so it’s a shift in weightings to the same stocks, not a different set of stocks. The design of the index is, in part, to ensure the mix of stocks doesn’t change much overtime. A key point here is that the index is designed to be investible at scale.
Why is this relevant to us? If we are retail investors and not moving the markets when we sell and buy stocks in $100m blocks, then we don’t need to suffer these major constraints. These constraints are so serious that it takes the best part of 10 years to see a material difference in the performance of the parent and momentum weighted indices. We would argue that momentum is only a small factor in these kinds of indices.
How did we build the portfolio?
The conditions for our test were as follows:
- We built Portfolios from a variety of international funds, rather than stocks
- This would give us cheap access to the broadest range of markets. If you are retail investor in the UK, the only practical way to access, Indian, Vietnamese, Canadian or other foreign stocks is through funds.
- Following Jegadeesh and Titman’s results, we chose funds according to their performance over the previous six months and then holding the portfolio for 6 months
- We did this starting a new portfolio every month for 6 months, giving us performance over 12 months of six portfolios.
- We looked at a universe of over eight hundred funds available to UK retail investors through investment platforms and selected four top performing funds each month, but with the proviso that they had to be from distinct themes
- For example, we wouldn’t pick four technology funds or four UK small-cap funds. The logic for this was to give us a less volatile result, but hopefully still capturing strong performance
We’ll look at the impact of only picking one or two or more funds as well.
How did our portfolio perform?
We picked portfolios starting in May 2023. The following year was a very strong period for equity returns, with the S&P500 rising over 25% over the period we looked at.
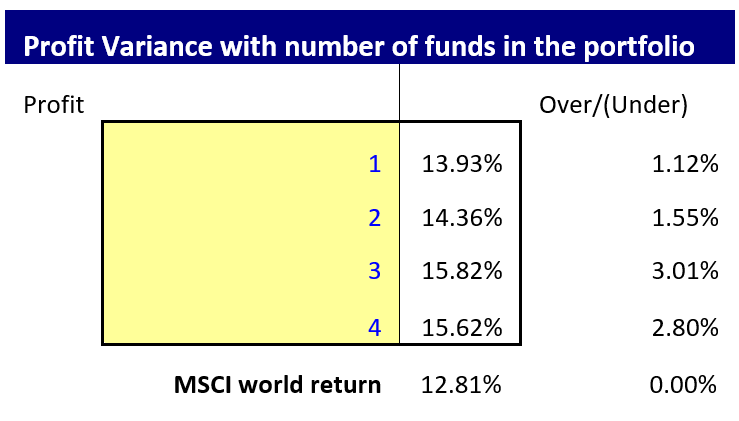
The average total return on our portfolios was 15.62% over their 6 month lives, compared with 12.81% for the MSCI world over the same period. So, a 2.8% outperformance over 6 months!
If we look at each of the individual portfolios and the MSCI over the same periods, i.e. May to November, then June to December and so on, we see:
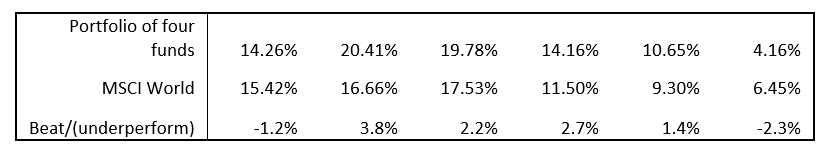
(this table shows returns from sequential 6-month periods each beginning one-month after the former).
Did choosing four funds give a worse result than going “all-in” on the best performer?
Interestingly, the best performance came from taking the top three funds. What we haven’t done is statistical testing to see if this is significant or just by chance, we’d need to do a much bigger study!
Past performance is no guarantee of future performance!
This table shows the performance of the “different funds” versus the MSCI.
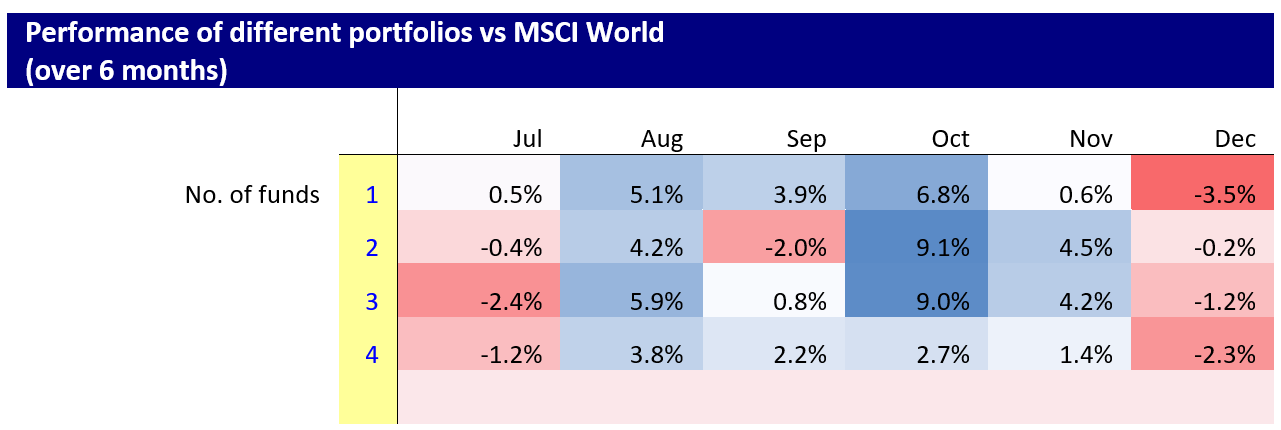
n.b. – “1 fund” = top performer only, 2 = top 2 from different sectors etc.
The way to read this is, in the first column we show how a portfolio of just the top fund, then the top two funds …and so on, performed vs. the MSCI over 6 months. Unsurprisingly, we never got a negative half year in this very-strong market, but in the first two portfolios starting in July and August, Tech gave a net negative return, falling over 10% then 5%. Then it recovered going up 9%, 26% and 20%. So, choosing more than one fund achieved what we wanted.
Are these results actually significant?
It is interesting to look at why our portfolio did so well:
Overlap
The MSCI world is dominated by the US (over 70% weight) and the technology stocks like Microsoft have big weightings, Microsoft alone is 4.4% of the MSCI World. So, technology, which was often a big component in our portfolio, also helped drive the MSCI world. The US was also heavily represented in our portfolios. There was a lot of overlap. Out of the twenty-four selections we made, technology funds appeared six times and North America four times.
A big difference in our portfolio is that in four out of six periods India funds were the top performer. Here are the portfolios in the first and last months:
| Portfolio in month one | Portfolio in month six |
| Technology & Innovations | India |
| North America all caps | Technology & Innovations |
| Technology &Innovations | Global |
| Global | Global |
Did we pick a convenient index to beat?
The obvious omission is emerging market stocks, but had we used the MSCI emerging markets index, which is 17.25% India, we would have performed even better on a relative basis! Over the same period the MSCI emerging markets index rose only 9.9%. By following momentum, we cherry-picked the brightest star from the EM universe at that time, India. We could have picked a 60/40 equity bond fund, mimicking a pension fund, but this wouldn’t have been a fair comparison; our momentum fund is going to be dominated by equities and have their volatility of returns and risk profile. An all-equity index (as we chose) is a fairer comparison.
We also need to take a broader perspective here: we, by chance chose one of the best performing indices to benchmark against because of its US and tech component. By following momentum, we allocated strongly to those sectors and then when India and Global stocks performed better, we got those!
We have ignored transaction costs.
This is the big issue but given the outperformance and the fact we are using funds, there is a very good probability that we would have outperformed even after spreads and dealing costs.
Given the intriguing results of this retroactive analysis, and potential gaps in the analysis, we decided to gather more data. As such, we’ll continue running a momentum investing portfolio as time progresses to see if it yields positive results, rather than a hindsight analysis.
Introducing the Capital City Training Market Momentum Tracker
We are going to start publishing a bi-weekly momentum survey, the Capital City Training Market Momentum Tracker, or the CCT MMT for short! This tracker will show which categories of funds are increasing in momentum and which are losing momentum. We’ll be sharing this analysis as updates on our blog and social media going forward.
Should you follow market momentum?
We must emphasise at this point that this is not investment advice, and we aren’t doing this to try and promote day trading! Instead, our aim is to correct one of the biggest mistakes that small investors make – having “home-market bias.” It is exactly what it says; if you are a French investor, the chance of the French market being the best performer in a year is low. Diversifying internationally will expose you to potentially higher performing markets. Following momentum indicators may make you consider markets that you were just not aware of, or never considered. Had you thought of investing in £ strategic bond funds?
Reading the financial press isn’t really very helpful in finding trends. In my experience, journalists only report on market performance at new peaks; when there is a sudden dramatic “against trend” move (as happened in gold in April 2024); at turning points when a market has fallen 10% or so from a recent peak; or at a new low for the year, half year or quarter. In short you will only read commentary when something has happened. It then is usually a contra-indicator – do the opposite.
We hope you’ve found this stimulating and that is has made you curious about momentum. If you would like a list of the actual funds we used and the performance data, feel free to get in touch with us at info@capitalcitytraining.com or reach out Mark Woolhouse on LinkedIn. Similarly, if you want to get our bi-weekly momentum reports and our monthly commentaries, keep an eye on our LinkedIn posts, or sign-up for our Newsletter in our blog to be notified when a new update goes live.
Remember stocks can go down as well as up!
Month 1 Update – CCT Market Momentum Tracker Analysis
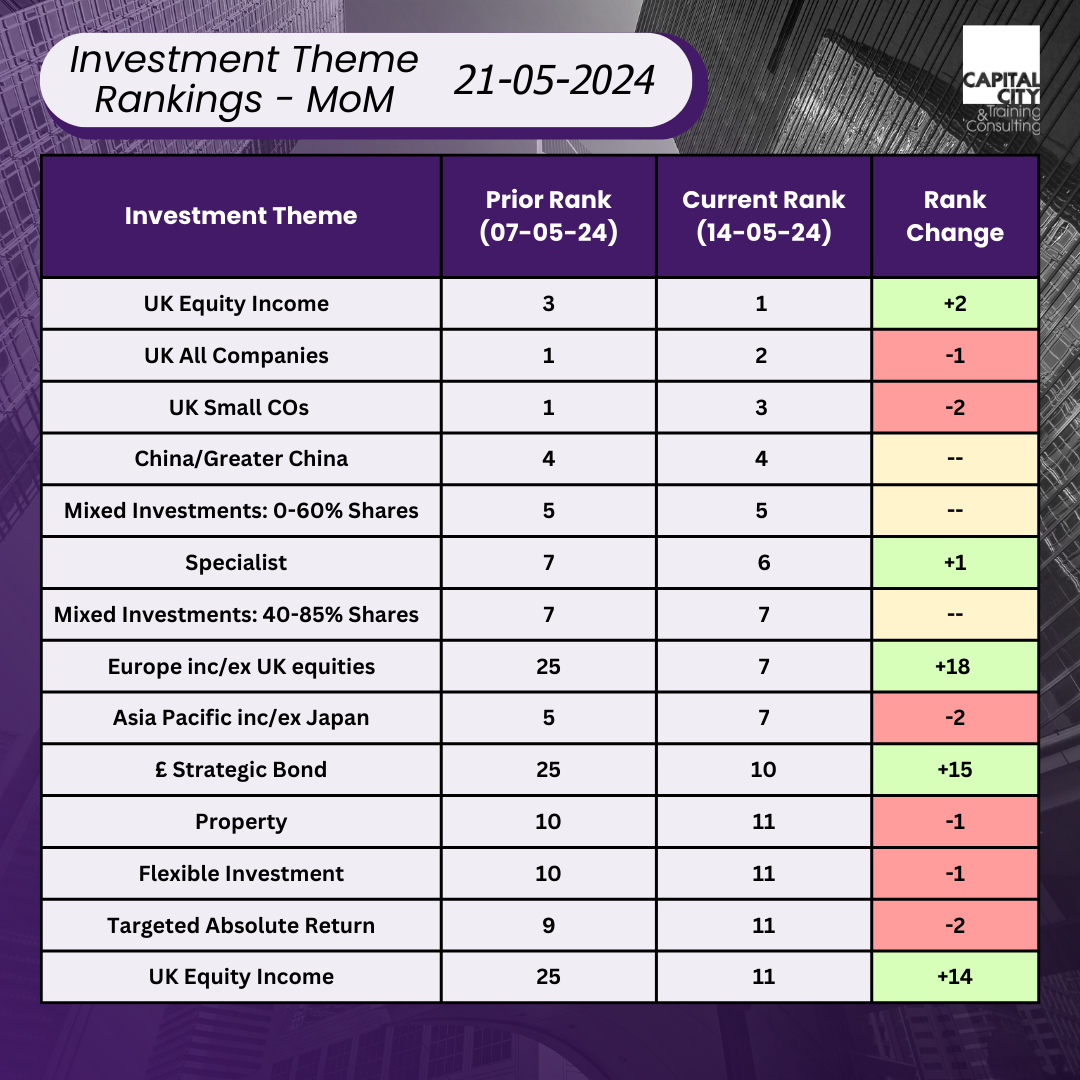
The table shows which category of funds – in this case UK Equity Income – had the largest proportion of funds in the top one hundred performers over the last four weeks. This is “rank 1”. So, UK equity income have moved up by two places from third place by number of winners since the week before. Europe inc./exc. UK has improved its position dramatically.
In our portfolio experiment we looked at 6 monthly returns. In this analysis we are looking at 4-weekly returns. The focus here is to potentially spot trends as they begin to develop, rather than when they are quite mature.
The story here, which we’ll elaborate on in another post, is how UK equities are performing very strongly at the moment. This momentum has been broadening, so spreading from large caps to small caps. UK all companies are performing. The whole UK market is going up. You can read our recent blogs to get the background to this story. This could be the proof that Goldman’s forecast for the UK performing strongly in 2024 could be correct. Maybe 2024 will be the UK market’s year in the sun!
Develop your Financial Knowledge

The sad waste of bright talent due to poor data visualisation skills
With data volumes growing 50 times in the last decade, using visualisation to present information effectively has become a critical

Portfolio Optimisation in Excel
Portfolio Optimisation in Excel If you would like a copy of the Excel spreadsheet containing the data and analysis

Conduct- Putting the pieces together
The subject of organisational conduct is very topical. Time was, that organisations, managers and society turned a blind eye,

Former banker turned entrepreneur. I successfully restructured, purchased, managed and sold a private engineering group, Steel Line Ltd, through an LBO and was also an equity partner in Corporate Training Group which my partners and I successfully sold to the AIM listed ILX group in 2006. I established Capital City Training Limited in early 2010 with my business partner Greg. We acquired MS Consultants a few years ago (so I’m still doing a bit of M&A). I have had non-exec roles for a small and growing VA/recruitment business and a fast-growing beverage logistics company. I am also an active investor.
Capital City Training is a full service technical and management development training company focused on the banking, wealth management and broader financial services and accounting industries. Having said all that, in the last couple of years we’ve been branching out into training for non-financial companies – manufacturing, retail, tech, defense.. so old and new economy. We also provide consultancy around modelling and are currently working for a leading PPP/PFI advisory firm. We have delivered training in every continent of the world in 2024… except Antarctica. Perhaps in 2025?! Watch this space.
Capital’s dedicated faculty combine extensive line experience as corporate financiers, bankers, traders, portfolio managers and equity analysts together with over 60 years of experience in learning and development as both procurers and providers of tailored in-house training, eLearning and blended learning. Our faculty also includes experienced Management development training specialists allowing us to provide HR consultancy services, management development training and also innovative integrated management development & technical training events. Capital City’s faculty embody over 100 years of line experience across the fields of accounting, corporate finance, derivatives, credit, lending, investment, equity research transaction banking and origination.