Net Present Value (NPV) Explained: Definitions, Formula and Examples
Net present value (NPV) is a core concept in corporate finance and investment analysis. It is a project / investments appraisal technique that is considered to be fundamentally the most robust, and consistent with the concept of enhancing shareholder value in investment appraisal. By calculating a NPV, companies can analyse the profitability of projects or investments whilst taking the time value of money (TVM) into account. Some investment appraisal methods fall short by ignoring TVM – for example the Payback Period.
The NPV calculation helps determine if a project will result in a net positive once allowing for the cost of capital invested in the project – thus assisting with making good investment decisions.
Article Contents
Key Takeaways
| Key Takeaway | Description |
| Definition | NPV is the difference between the present value of cash inflows and outflows over time. It accounts for the time value of money. |
| Formula | NPV = ∑ Present Value of Cash Flows over n time periods |
| Positive vs Negative NPV | Positive NPV indicates value creation. Negative NPV indicates value destruction. |
| Uses | Evaluating investments, capital projects, acquisitions, capacity expansion, asset purchases, product pricing. |
| Excel Calculation | Use the NPV function, entering discount rate and cash flows as inputs. |
| Annuity NPV | Can calculate NPV of equal cash flows (annuity) using an annuity factor. |
| Limitations | Dependent on accuracy of cash flow estimates. Does not remove all uncertainty. |
| Best Practices | Use NPV along with other metrics like IRR and payback period for full analysis. |

What is NPV?
Net present value, or NPV, is defined as the difference between the present value of cash inflows and the present value of cash outflows over a period of time. It compares the present value of cash flows at any point in time relating to an investment project, taking required returns (%) into account. The NPV calculation uses a discount rate to bring future cash flows back to present day dollars. The discount rate is commonly taken as the Weighted Average Cost of Capital (WACC) for the business – i.e. what is the average cost of funding our business, taking the cost of debt and the required return on equity into account?
A positive NPV indicates projected value-added on the investment, over and above the cost of capital. A negative NPV indicates value-destruction, or a project that does not generate sufficient returns for investors. To clarify, a negative NPV does NOT necessarily mean a project isn’t profitable: it means that it is not generating sufficient returns to satisfy the expected returns of investors.
Formula for Calculating NPV
The formula for calculating NPV is:
NPV = Present Value of Cash Inflows – Present Value of Cash Outflows
Or
NPV = ∑ Present Value of Cash Flows over n time periods
Where:
- Cash flows = Estimated after-tax cash flows for each time period
- Discount rate = Required rate of return or cost of capital
- n = Number of time periods
To find the present value of each cash flow, the formula is:
Present Value = Cash flow * Discount factor
Where the Discount Factor is (1 + discount rate) ^ n
For example, if the cash flow in year 1 is £100, and the discount rate is 5%, the present value of the year 1 cash flow is:
Present Value = £100 * (1 + 0.05)^1 = £100 / 1.05 = £95.24
This brings the £100 cash flow back to today’s dollars, accounting for the 5% discount rate. Doing this calculation for each cash flow and summing them gives you the NPV.
Calculating NPV in Excel
NPV is easy to calculate in Excel using the =NPV function. The inputs are:
- Rate = discount rate (cost of capital, in %)
- Values = cash flows for each period
Be careful about the way this function works when selecting cells referring to the project cash flows. The NPV function will discount ALL selected cash flows and assumes the first cash flow in the series is 1 year after the start of the project – so make sure not to include the initial investments in the selected data for the NPV function. An illustration will help.
For example, take a project with an initial investment of £1000, then annual cash flows of +£300, +£500, +£650, +£700 respectively. The company has a cost of capital of 8%
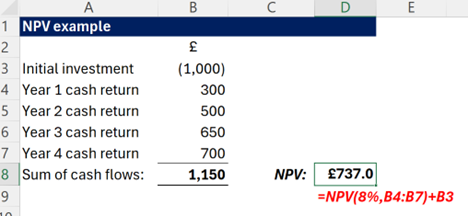
As you can see, the resulting NPV is £737, and note that the initial investment of £1000 is NOT included in the NPV function but is taken off at the end – we don’t want to discount the initial investments as it is already a present value!
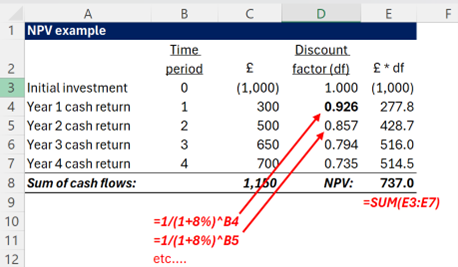
Many analysts prefer to show the discount factors separately, to ensure transparency in their calculations: the same example giving us:
Practical Application of NPV
NPV has many practical applications in corporate finance and investment analysis:
- Evaluating capital projects – Companies routinely use NPV to analyse proposed investments in new equipment, plants, IT systems, and other capital projects. An investment is typically only approved if the NPV exceeds a minimum hurdle rate (which may be more than the company’s WACC, to allow for project risk)
- Comparing alternative projects – When choosing between multiple competing investment options, companies will calculate the NPV of each project and rank based on highest positive NPVs. The reason for this is that it is fundamentally consistent with adding shareholder value.
- Analysing acquisitions or divestitures – NPV helps assess the value of buying another company or selling off a division based on projected cash flows cost / savings.
- Capacity expansion decisions – Incremental investments to expand production capacity should be supported by an incremental NPV analysis.
- Asset purchase decisions – Whether buying equipment, vehicles, or other assets, NPV guides the investment decision and total amount to pay.
- Product pricing – When making pricing decisions, businesses may use an NPV model to determine the optimal pricing level.
Essentially, whenever a business is allocating capital, NPV helps management make better financial decisions.
NPV for Annuities
Annuities are a series of equal cash flows made over a number of periods. The NPV of an annuity can be calculated using an annuity factor:
NPV of Annuity = (Annual Annuity Amount) x (Annuity Factor)
The annuity factor is based on the number of periods and discount rate, and tables to look up the factor are readily available. Having said that, Excel is much more convenient!
Practical applications of discounting annuities include bond valuation and determining the present value of pension obligations.
Misconceptions
Some common misconceptions about NPV include:
- Higher NPV is always better – Sometimes overly optimistic assumptions can lead to an artificially inflated NPV, so other factors must also be considered.
- NPV should be used alone – While a key metric, NPV should be used together with other metrics like IRR and payback period to evaluate investments fully.
- NPV means guaranteed profits – Since NPV relies on cash flow projections, the analysis is dependent on the accuracy of those estimates. There is no guarantee the actual results will match.
- NPV removes all uncertainty – Even with discounting for risk and opportunity cost, NPV cannot account for unknowns like competitive factors or economic changes.
NPV is an important and useful calculation, but should be applied carefully with other tools to support strategic financial decisions.
Case Studies illustrating NPV usage
Case Study 1: Renewable Energy Project
A leading energy company was evaluating an investment in a large-scale solar power project. The project required an initial investment of £500 million with expected annual cash inflows from energy sales of around £80 million for 20 years. Using a discount rate of 8%, which reflected the project’s risk and the company’s cost of capital, the NPV calculation showed a positive value, indicating that the project was a viable investment. This analysis played a crucial role in the company’s decision to proceed with the project.
Case Study 2: Pharmaceutical R&D Investment
A pharmaceutical company considered investing in the research and development (R&D) of a new drug. The project involved an initial investment of £200 million and promised potential cash inflows from drug sales after regulatory approval. Despite high initial costs and the uncertainty of drug approval, the NPV analysis, which incorporated various scenarios of success and failure, showed a significantly positive NPV for the most likely scenario. This gave the company confidence to invest in the R&D project.
Case Study 3: Acquisition Decision
A multinational corporation was considering the acquisition of a smaller competitor. The acquisition was priced at £1 billion, with expected synergies and cost savings leading to additional annual cash inflows. By calculating the NPV of the projected cash flows, using a discount rate that accounted for the acquisition’s risks and financing costs, the corporation determined that the acquisition would have a positive NPV, leading to the decision to go ahead with the purchase.
In summary, NPV is a crucial metric in corporate finance that compares the present value of cash inflows to outflows to analyse profitability. The NPV calculation requires estimating cash flows, choosing a discount rate, and determining present values. It has widespread applications in investment analysis and drives many capital budgeting and resource allocation decisions. While a powerful tool, NPV should be complemented with other metrics and applied with care to ensure sound financial decisions.

NPV FAQs

Former banker turned entrepreneur. I successfully restructured, purchased, managed and sold a private engineering group, Steel Line Ltd, through an LBO and was also an equity partner in Corporate Training Group which my partners and I successfully sold to the AIM listed ILX group in 2006. I established Capital City Training Limited in early 2010 with my business partner Greg. We acquired MS Consultants a few years ago (so I’m still doing a bit of M&A). I have had non-exec roles for a small and growing VA/recruitment business and a fast-growing beverage logistics company. I am also an active investor.
Capital City Training is a full service technical and management development training company focused on the banking, wealth management and broader financial services and accounting industries. Having said all that, in the last couple of years we’ve been branching out into training for non-financial companies – manufacturing, retail, tech, defense.. so old and new economy. We also provide consultancy around modelling and are currently working for a leading PPP/PFI advisory firm. We have delivered training in every continent of the world in 2024… except Antarctica. Perhaps in 2025?! Watch this space.
Capital’s dedicated faculty combine extensive line experience as corporate financiers, bankers, traders, portfolio managers and equity analysts together with over 60 years of experience in learning and development as both procurers and providers of tailored in-house training, eLearning and blended learning. Our faculty also includes experienced Management development training specialists allowing us to provide HR consultancy services, management development training and also innovative integrated management development & technical training events. Capital City’s faculty embody over 100 years of line experience across the fields of accounting, corporate finance, derivatives, credit, lending, investment, equity research transaction banking and origination.