Top Financial Software and Tools Used in Investment Banking
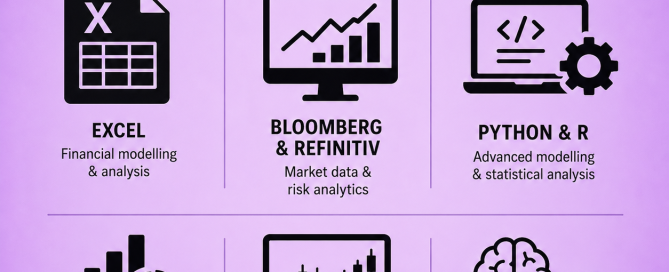
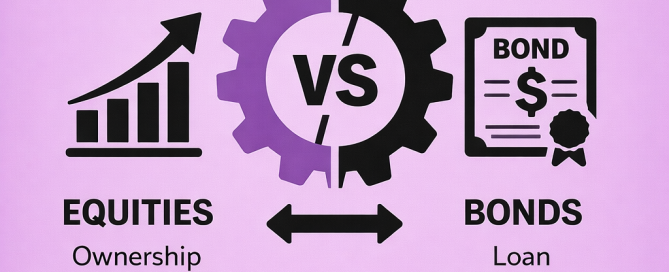
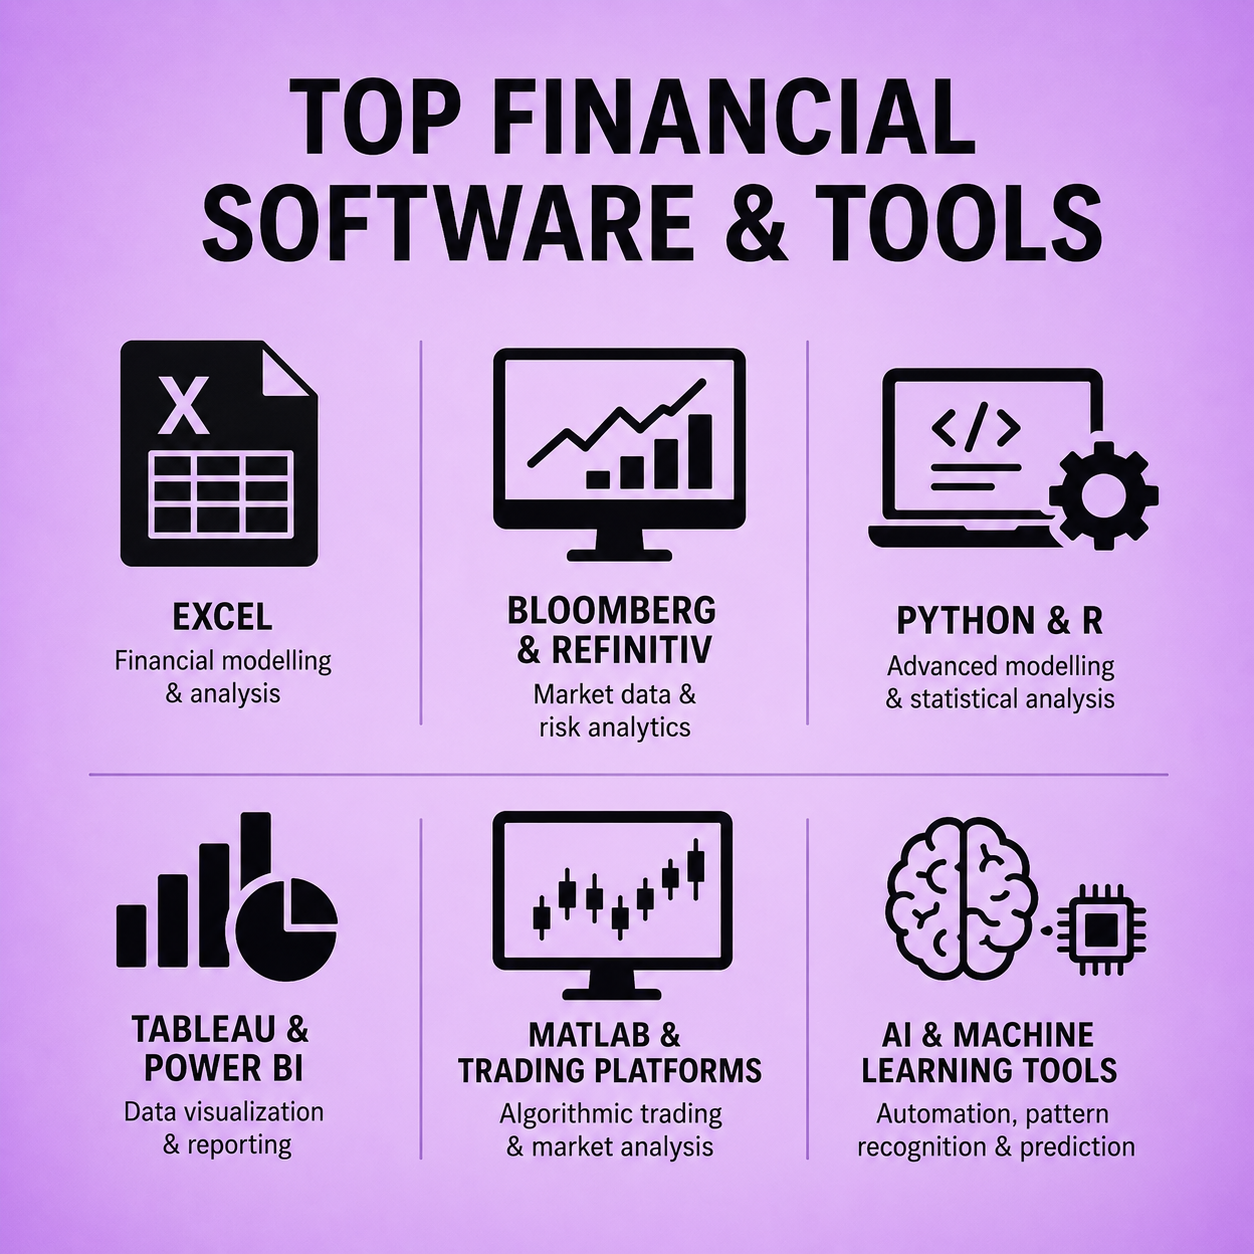
Top Financial Software and Tools Used in Investment Banking Investment bankers and financial professionals rely on software and statistical tools not just for number-crunching, but for making dispassionate decisions under pressure—the kind that help you sleep at night when markets turn volatile. The landscape of statistical software in finance has evolved considerably, yet


