Income Statement: Definition, Formula and Examples
In the world of financial accounting and business analysis, the income statement stands as one of the most crucial financial statements that analysts, investors and businesses themselves use to evaluate the financial performance of a company over a specific time period. This fundamental document, also known as the profit and loss statement (P&L), provides stakeholders with vital information about a company’s revenue, expenditure, and profitability. Understanding how to interpret and analyse an income statement is essential for financial professionals, investors, and business managers alike.
Article Contents
Key Takeaways
| Category | Key Points |
| Definition | A financial report measuring company performance over a specific period by detailing revenues and expenses. Also known as profit and loss statement (P&L) or statement of operations. |
| Key Components | Revenue (Top Line), Cost of Goods Sold (COGS), Gross Profit, Operating Expenses, Operating Income, Non-operating (financial) items, Tax expense, Net Income (Bottom Line). |
| Basic Formula | Net Income = (Revenue – COGS – Operating Expenses – Non-operating Expenses) + Non-operating Income – Taxes |
| Statement Types | Single-step (simpler format for service businesses) vs Multi-step (detailed format preferred by manufacturing companies) |
| Industry Gross Margins | Retail: 25-35%, Manufacturing: 25-40%, Software/Technology: 70-85%, Services: 60-75%, Healthcare: 50-65% |
| Preparation Steps |
|
| Operating Expenses | Includes SG&A (Sales, General and Admin), R&D, Marketing, Rent, Utilities, Salaries, Benefits, Depreciation and Amortisation |
What is an income statement?
An income statement is a financial report that measures a company’s financial performance over a specific accounting period by detailing all revenues and expenses. The statement begins with revenue and works its way down through various expense categories to arrive at the bottom line, which represents either a profit or loss. This vital document helps stakeholders understand how efficiently a company converts its revenue into profits.
Components of an Income Statement
The income statement comprises several key components that work together to provide a comprehensive view of a company’s financial performance. Each component represents a specific aspect of the business’s operations and contributes to the overall understanding of profitability.
Revenue (Top Line)
Revenue, often referred to as the “top line,” represents the total amount of money earned from selling goods or services during the accounting period. This figure includes:
- Primary revenue from core business activities
- Secondary revenue from additional business activities
Revenue is recorded before any expenses or costs are deducted, providing a starting point for calculating profitability.
Revenue is recorded when goods are sold or services are provided (the revenue is deemed ‘earned’ – not when the cash is received by the company. This is a major reason that cash does not equal profit! Any revenue earned but not collected as cash is shown in the balance sheet as a ‘Receivable’.
Revenue is also stated net of sales tax. For all businesses that are not financial institutions, interest income is not part of revenue. It is considered ‘finance income’ and is shown after the core operating revenue and expenses, along with interest expense.
Cost of Goods Sold (COGS)
COGS represents the direct costs associated with producing goods or services sold during the period. These costs typically include:
- The cost of producing any inventory sold
- Direct labour costs (labour involved in the manufacturing process or provision of the services sold)
- Manufacturing overheads
Understanding COGS is crucial as it directly impacts gross profit and overall profitability.
Gross Profit
Gross profit is calculated by subtracting COGS from revenue. This figure represents the profit earned before accounting for operating expenses, taxes, and other costs. Typical gross margin ranges vary by industry:
- Retail: 25-35%
- Manufacturing: 25-40%
- Software/Technology: 70-85%
- Services: 60-75%
- Healthcare: 50-65%
Operating Expenses
Operating expenses include all costs associated with running the business that are not directly tied to production / provision of services. These typically include:
- Selling, General, and Administrative expenses (SG&A)
- Research and Development costs
- Marketing and advertising expenses
- Rent and utilities
- Employee salaries and benefits
- Depreciation of fixed assets and amortization of intangible assets
Operating Income
Operating income, also known as operating profit or EBIT (Earnings Before Interest and Taxes), is calculated by subtracting operating expenses from gross profit. This figure represents the profit generated from core business operations before accounting for non-operating items.
Non-operating Items
Non-operating items include revenues and expenses that are not directly related to core business operations, such as:
- Interest income and expenses
- Investment gains or losses
- One-time charges or credits
- Foreign exchange gains or losses
These items affect the final net income but are separated from operating activities to provide a clearer picture of core business performance vs non-operating (typically finance) items.
Net Income
Net income, also known as the “bottom line,” represents the final profit or loss after all revenues, expenses, gains, losses, and taxes have been accounted for. This figure is crucial for:
- Evaluating overall profitability
- Determining dividend payments
- Assessing management effectiveness
- Making investment decisions
Income Statement Formula & Equation
Rather than a formula, think of the P&L as a flow of numbers from Revenue down to Net Income, at each stage showing different types of expenditure.
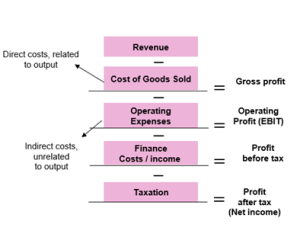
| Item | Notes |
|---|---|
| Sales / Revenue / Turnover | Net of any sales tax and customer rebates |
| Less cost of goods sold (CoGS) | NOT cost of purchases / production, but only the cost of purchasing/producing the goods that have been sold.
Generally, all at historic cost. |
| = Gross profit | |
| Less operating costs | Typically, depreciation and amortization, selling, general and administrative costs (e.g. distribution, marketing and other head-office costs – IT, finance, Legal, HR, management) |
| = Operating profit | |
| Less finance costs (plus finance income) | = Interest on debt and bank fees. Usually net of any interest income (but detail in the notes) |
| = Profit before tax | ‘PbT’ |
| Less taxation | This is the provision for tax based on current year’s earnings – not the same as tax actually paid in the year. |
| = Net profit after tax (‘Net Income’, ‘Equity earnings’) | From this number, dividends may still be paid before carrying the residual earnings into Retained Earnings (part of equity in the balance sheet) |
The basic income statement formula follows this structure:
Net Income = (Revenue – COGS – Operating Expenses – Non-operating Expenses) + Non-operating Income – Taxes
EBITDA = Net Income + Interest + Taxes + Depreciation + Amortization, but note that Depreciation is not shown as a single item in the P&L and will only be disclosed in the notes to the P&L.
The equation can be broken down into several steps:
- Gross Profit = Revenue – COGS
- Operating Income = Gross Profit – Operating Expenses
- Income Before Taxes = Operating Income + Non-operating Items
- Net Income = Income Before Taxes – Taxes
Dividends and Retained Earnings
Dividends are the share of Net Income that is paid to equity shareholders. As it is a distribution of profit it is not itself part of the P&L.
Any residual income after dividends are paid is added to the company’s Retained Earnings in the Balance Sheet. Not all income will be paid out to investors as the company may not have the cash – a lot of the cash earnings will have been reinvested in company assets, or used to repay debt. These are financing activities that will not be shown in the P&L as they are not part of the income / expenditure of the business. This reinvestment or debt repayment will be shown only in the Cash Flow Statement – which is why the P&L is not a complete picture of cash and must never be used to evaluate liquidity of a business.
Example Calculation:
- Revenue: $1,000,000
- COGS: $600,000
- Operating Expenses: $200,000
- Interest Expense: $30,000
- Taxes: $42,500
- Step 1: Gross Profit = $1,000,000 – $600,000 = $400,000
- Step 2: Operating Income = $400,000 – $200,000 = $200,000
- Step 3: Income Before Taxes = $200,000 – $30,000 = $170,000
- Step 4: Net Income = $170,000 – $42,500 = $127,500
Analysing the P&L
Analysing the P&L will typically involve two steps:
- Have the absolute numbers (revenue or expense) increased or decreased year-on-year
- If up or down, how does this compare to peers and have cost or profit margins improved / deteriorated. (margins are simply the relevant number as a % of revenue. For example, a company’s gross profit may have increased but gross profit margin may have fallen, indicating a less efficient conversion of revenue into profit – a signal to be investigated!)
Using the income statement, analysts and investors will typically:
- Analyse income statement trends over time, especially for revenues, expenses, and profit margins
- Look at growth rates and profitability ratios like gross margin, operating profit margin and net margin.
- Compare to peers and industry averages and past performance to gauge operational efficiency and management effectiveness.
- Identify major variances from prior years and their underlying causes
This will provide some insight as to whether the business is improving, deteriorating and whether management strategy is working to improve returns to shareholders.
Common Interview Questions Regarding the Income Statement
1. “What are the main components of an income statement?”
Answer: The main components include revenue, COGS, gross profit, operating expenses, non-operating items, and net income.
2. “How does the income statement relate to other financial statements?”
Answer: The income statement connects to the balance sheet through retained earnings and to the cash flow statement through operating activities.
3. “Why might a company’s net income differ from its cash flow?”
Answer: Revenue is recognized in the P&L when earned, and expenses are recognized as incurred (not necessarily paid). So there may be non-cash revenue and non-cash expenses, These timing differences in revenue recognition, and accrual accounting principles can cause disparities between net income and cash flow.
Also, investing and financing activities are not shown in the P&L (e.g. purchase / sale of PPE, borrowing / repaying money (debt) and the payment of dividends. These are only some examples, but are the big ones!
4. “How can you use the income statement to assess a company’s performance?”
Answer: Key metrics like gross margin, operating margin, and net profit margin can be calculated to evaluate efficiency and profitability. But simply looking at revenue growth and operating profit / net income growth are simple, useful numbers.
The income statement serves as a vital tool for understanding a company’s financial performance and profitability. By mastering its components, formulas, and preparation methods, financial professionals can better analyse business operations and make informed decisions. Whether you’re preparing for interviews, conducting financial analysis, or managing a business, a thorough understanding of income statements is essential for success in the financial sector.
Income Statement FAQs

An experienced finance and training professional and Co-Founder of Capital City Training Ltd, Greg has a demonstrated history of working in the financial services sector and has a passion for sharing his knowledge and skills throughout the financial services sector. He has been partnering financial and corporate clients in designing and delivering applied financial programs that make an impact on business outcomes. Greg is skilled in accounting & financial analysis, derivatives and risk management, financial modelling, business valuation and corporate finance and has worked with the worlds leading financial institutions. A strong business development professional and a qualified accountant (ICAEW member), CFA Charterholder and Associate Member of the Association of Corporate Treasurers in the UK (ACT).