LBO Modelling Explained: Definitions, Concepts, and Examples
LBO (Leveraged Buyout) Modelling is one of the core tools for M&A in corporate finance. LBO models are a type of financial model which is built to evaluate the financial viability and returns of a leveraged buyout transaction.
Article Contents
Key Takeaways
| Takeaway | Description |
| Leveraged Buyout (LBO) Definition | An LBO is the acquisition of a company using substantial debt financing, where the assets of the acquired company serve as collateral. |
| LBO Process | Involves sourcing funding, acquiring the target company, operating the business post-acquisition, and eventually repaying the debt and exiting the investment. |
| LBO Model Structure | Key components include the purchase price, sources and uses, debt schedules, financial statements, returns analysis, and sensitivity analysis. |
| Key LBO Metrics | Critical metrics assessed include leverage and interest coverage ratios, fixed charge coverage, credit statistics, and returns like IRR and money multiple. |
| Building an LBO Model | Follows a sequential approach: define purchase price, link to debt schedule, project financials, calculate returns, and conduct sensitivity analysis. |
| LBO Considerations | Assessing ability to service debt, cost flexibility, growth prospects, interest rates, regulatory issues, customer/supplier risks, and exit strategies. |

What is a Leveraged Buyout?
A leveraged buyout (LBO) is the acquisition of a company or business unit, where the buyer finances the purchase price through substantial debt financing. Notably, the assets of the company being acquired typically serve as collateral for the debt.
LBO Process
An LBO transaction typically involves several steps:
Step 1 – Funding Sourcing
A private equity firm or investor consortium forms a new entity (“Newco”) to acquire the target company. The equity funds contribute approximately 30-50% of the purchase price to Newco, termed the equity contribution.
Newco secures a mix of bank loans, subordinated high yield bonds (or mezzanine finance in smaller transactions) for the remaining portion of the purchase price. This is where the “leveraged” comes into “LBO”. Since the global financial crisis the debt funding of LBOs has changed. Private equity fund managers and dedicated debt fund managers created many new Debt funds, mobilising capital from insurers and pension funds to compete with banks. Fund managers also create Collateralised Loan and Debt Obligations, “CLOs” and “CDOs” (yes – the financial tools that caused the credit crunch!) to compete with banks.
Today these non-bank lenders dominate the business of financing LBOs with the banks often only providing revolving credit facilities (“RCFs”) to fund seasonal working capital needs.
A big competitive advantage of the debt funds is that they provide exclusively longer-maturity bullet loans (i.e. they don’t amortise). This is very attractive to borrowers.
Step 2 – Acquisition
Newco utilizes the proceeds from the equity and debt to fund the acquisition.
Step 3 – Post-acquisition
Newco now owns the target company. Generally in LBOs the company will not repay its debt! In fact, if the company’s operations improve – as a result of investment and active management – the investors will “re-leverage”: they will go back to lenders and refinance or increase their existing loans and use the extra money raised to return capital to the equity investors. This process is called a “leveraged recapitalisation”.
The LBO of Verallia by Apollo in 2015 was roughly one third financed with €1Bn of equity. Within just over a year and a half, the company returned over €500m to investors. The debt equity ratio went from 2:1, to 5:1! The speed at which private equity funds return capital and “derisk” the investment is a really important issue for investors. The risk has been transferred to the debt holders!
Step 4 – Debt Repayment
All of the debt will (hopefully) be repaid when the private equity investors sell the company after 3-5 years. This hold period is typical and is driven by the Private equity fund’s mandate. In this contract between the partners, the fund manager, the General Partner or “GP” will commit to return all monies invested back to shareholders typically within 7-10 years.
Successful buyouts enable equity investors to realize returns through eventual exits, like an IPO or business sale.
Structure of an LBO Model
A standard LBO model embraces the following key components:
- Purchase price and sources & uses of funds – This details the total funds needed and sources, such as equity and debt used to finance the deal.
- Debt schedules – In these, the cashflows and accruals of each of the individual finance facilities – principal schedules, and interest payments for senior and subordinated debt instruments – are calculated.
- Income statement – Projecting the company’s revenues, expenses, EBITDA, interest expense, and net income.
- Balance sheet – Estimating the company’s assets, liabilities, and equity position over time.
- Cash flow statement – Projecting operating, investing, and financing cash flows.
- Returns analysis – Calculating IRR, multiples, and equity returns to the PE sponsors.
Key Financial Metrics for LBO Models
Critical financial metrics assessed in an LBO model include:
- Debt/EBITDA and EBITDA/Interest coverage ratios – These are used to evaluate the company’s leverage capacity and ability to service debt and the risk profile of lenders.
- Fixed charge coverage ratio – This is a more comprehensive measure of the company’s ability to meet its debt service from its free operating cash flow. These ratios will all potentially trigger default in a bank financed deal if they breach preset limits.
- Cash flow available for debt service CFADS / Principal and interest due in the year
- Credit statistics – Metrics such as Average Debt/EBITDA, Minimum Debt/EBITDA, and Maximum Debt/EBITDA are analysed.
- Returns analysis – IRR, Multiple of Invested Capital (MOIC) or the money multiple is the ratio of the equity value of the company on exit divided by the cash equity invested by the investors. A result in excess of 2.2x over 4-5 years is a good result in an LBO. The multiple of Enterprise Value/EBITDA on Exit is very important. Increasing this multiple by one times, i.e. by selling for a higher price, will increase the IRR or internal rate of return to investors by typically 3%.
How to Build an LBO Model in Excel
Here’s a sequential approach for constructing an LBO model in Excel:
- Define the purchase price, sources, and uses schedule.
- Link the sources and uses to the debt schedule.
- Develop the income statement forecasts, including revenue, operating expenses, and EBITDA.
- Input opening balance sheet figures and projections.
- Construct the cash flow statement and link it with other financial statements.
- Calculate returns analysis and key credit statistics.
- Conduct sensitivity analysis, evaluating key valuation drivers, and their impacts on outcomes.
Considerations for Leveraged Buyouts
Assessing an LBO necessitates a thorough evaluation of:
- Ability to Service High Debt Load – A fundamental assessment of the target’s cash flows and their adequacy to meet debt obligations
- Cost Flexibility – The adaptability of costs, especially in scenarios where revenues may decline
- Growth Prospects – An appraisal of the upside potential and growth prospects of the target company
- Interest Rates – An examination of prevailing interest rates and the overall financing environment
- Regulatory Approvals – Anti-trust problems are an increasing challenge for private equity companies, these potential regulatory hurdles or approvals need to be anticipated and planned for
- Customer & Supplier Concentration – Investigating the reliance on key customers or suppliers and understanding associated risks
- Exit Strategies – An evaluation of potential exit strategies, ensuring they align with investor objectives and market conditions, such as IPOs, strategic sales, or recapitalizations, and understanding their respective implications on returns and holding periods
LBO Model Case Study: Exploring Practical Application
We can demonstrate the use of an LBO model with a simplified case study:
Scenario: A private equity firm aims to acquire Company XYZ, with an EBITDA of $100 million, at an 8x EBITDA multiple, using 60% debt and 40% equity.
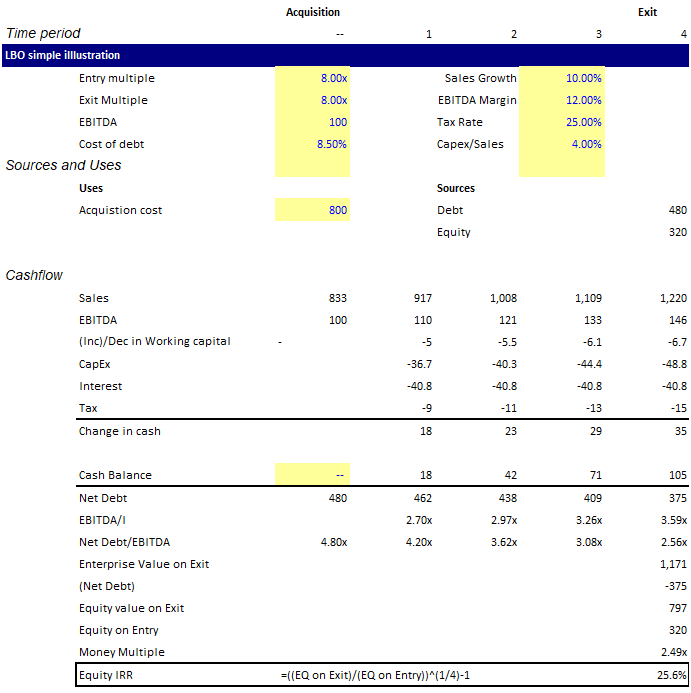
The Modelling Approach for this is as follow:
- Purchase Price: Calculate the acquisition cost ($800 million).
- Financing Structure: Detail the debt and equity portions.
- Projections: Develop projections for revenue, EBITDA, and free cash flows.
- Debt Repayment: Articulate the debt repayment schedule, considering interest rates and cash flows.
- Exit Evaluation: Model different exit scenarios and calculate the respective IRRs and money multiples.
Key Takeaways: Critically, the model shows whether the debt can be serviced, are the fund’s return hurdles met, and what is the financial risk being taken by lenders. This simplified case demonstrates the applicability of LBO modelling in evaluating and structuring investment opportunities.
Exercises and Examples for LBO Modelling
Some exercises you will want to try yourself to get to grips Leveraged Buyout Models are:
- Building a basic 3-statement LBO model from scratch.
- Modelling an LBO acquisition with a particular company case study.
- Conducting sensitivity analysis on key LBO model assumptions.
- Creating an LBO model template with adaptable inputs and dynamic formulas.
- Reading equity and debt financing term sheets and incorporating them into a model.
- Assessing debt capacity, interest coverage ratios, and credit statistics.
Develop your proficiency in LBO modelling with our LBO training course, featuring case studies and exercises with Excel walk-throughs for all the examples above.

LBO FAQs

Former banker turned entrepreneur. I successfully restructured, purchased, managed and sold a private engineering group, Steel Line Ltd, through an LBO and was also an equity partner in Corporate Training Group which my partners and I successfully sold to the AIM listed ILX group in 2006. I established Capital City Training Limited in early 2010 with my business partner Greg. We acquired MS Consultants a few years ago (so I’m still doing a bit of M&A). I have had non-exec roles for a small and growing VA/recruitment business and a fast-growing beverage logistics company. I am also an active investor.
Capital City Training is a full service technical and management development training company focused on the banking, wealth management and broader financial services and accounting industries. Having said all that, in the last couple of years we’ve been branching out into training for non-financial companies – manufacturing, retail, tech, defense.. so old and new economy. We also provide consultancy around modelling and are currently working for a leading PPP/PFI advisory firm. We have delivered training in every continent of the world in 2024… except Antarctica. Perhaps in 2025?! Watch this space.
Capital’s dedicated faculty combine extensive line experience as corporate financiers, bankers, traders, portfolio managers and equity analysts together with over 60 years of experience in learning and development as both procurers and providers of tailored in-house training, eLearning and blended learning. Our faculty also includes experienced Management development training specialists allowing us to provide HR consultancy services, management development training and also innovative integrated management development & technical training events. Capital City’s faculty embody over 100 years of line experience across the fields of accounting, corporate finance, derivatives, credit, lending, investment, equity research transaction banking and origination.