Weighted Average Cost of Capital (WACC): Formula, Analysis, Examples
The Weighted Average Cost of Capital (WACC) is a key component in discounted Cash flow valuation (or “DCF” for short). In a nutshell it is the market-value weighted average AFTER-TAX cost of debt and equity of a company.
DCF is one the two most fundamental company valuation tools, the other being comparable company analysis.
As well as being the rate at which we discount a company’s cashflows, WACC is also used in performance metrics like ROIC/WACC, as a fundamental measure of the ability of a company to generate value.
Understanding WACC is crucial for financial professionals, investors, and business owners alike. It drives equity markets and impacts merger and acquisition activity: As interest rates and inflation rose during 2022 and 2023, the WACC of all companies rose. This depressed equity markets and contributed to falls in new issue of shares (global volumes fell over 50%) and also led to reduced levels of merger and acquisition activity: Private Equity funds found they could not realise their investments at the high valuations they had hoped for.
Article Contents
- What is Weighted Average Cost of Capital?
- WACC in Context
- Key Components of WACC
- Cost of Equity
- Pre-Tax Cost of Debt
- Market Value of Equity and Debt
- Steps and Formula for Calculating WACC
- Interpreting WACC in Finance
- Alternative WACC Calculation Methods
- Performing Sensitivity Analysis with WACC
- Examples and Case Studies for WACC
Key Takeaways
| Key Takeaway | Description |
| Definition | WACC is the market-value weighted average after-tax cost of debt and equity of a company. It represents the overall cost of capital. |
| Importance | WACC is crucial for financial professionals, investors, and business owners. It drives equity markets and impacts mergers & acquisitions. |
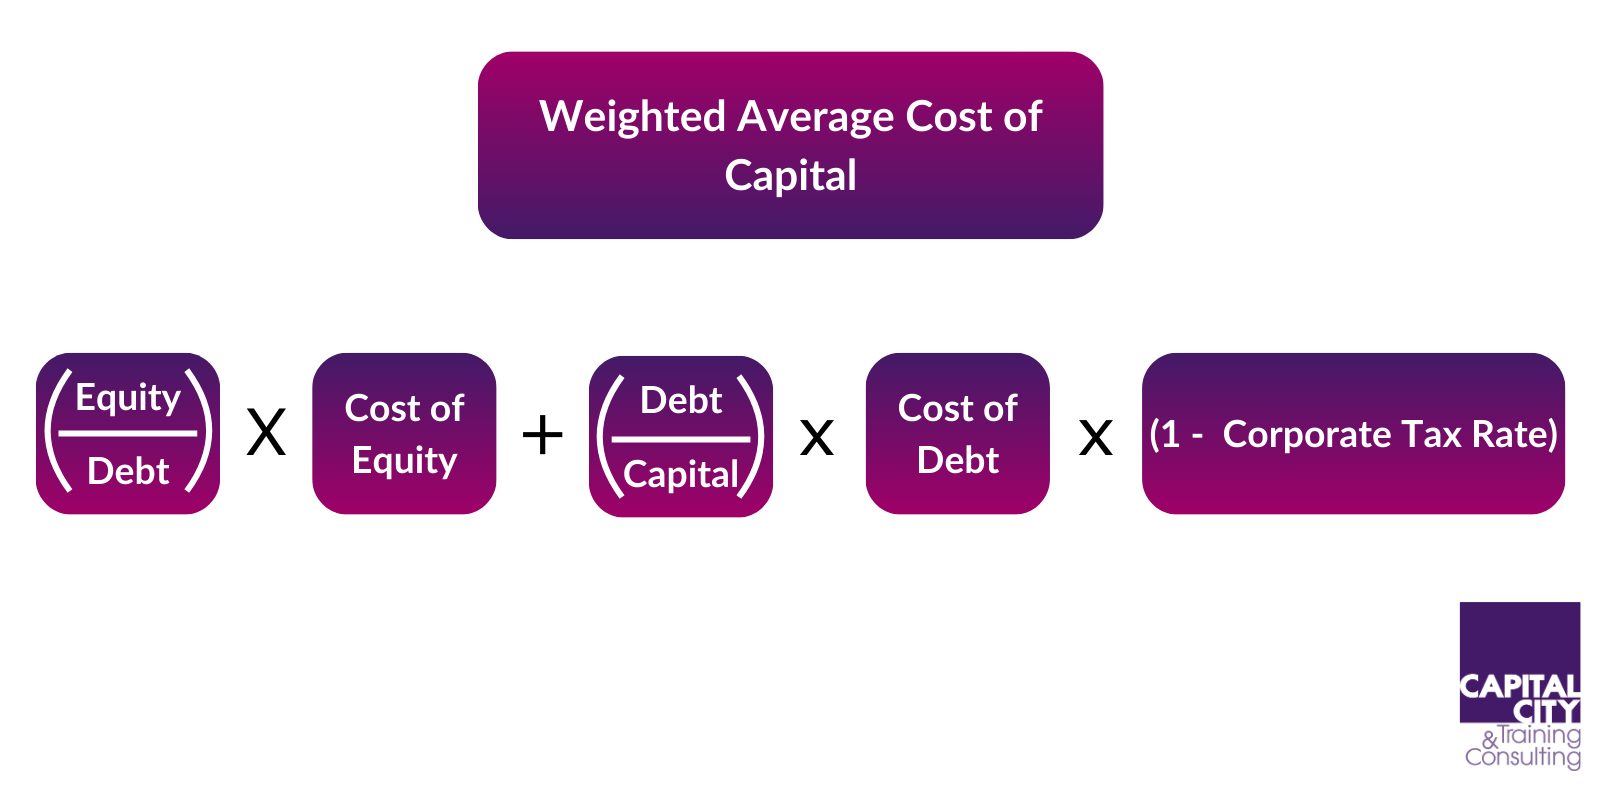
| Formula | WACC = (E/V) x Re + (D/V) x Rd x (1-T), where E is market value of equity, D is market value of debt, V is total market value of capital, Re is cost of equity, Rd is cost of debt, and T is corporate tax rate. |
| Components | WACC calculation involves three primary components: cost of equity, cost of debt, and their respective weights. |
| Cost of Equity | Calculated using the Capital Asset Pricing Model (CAPM) or Gordon’s Dividend Growth Model (DGM). |
| Cost of Debt | Determined by synthesizing long-term government bond yield, credit spread, and tax effects. |
| Market Values | Market values of equity and debt should be used for accurate WACC calculation. |
| Applications | WACC is used in investment evaluation, capital budgeting, determining optimal capital structure, valuation, and performance evaluation. |
| Sensitivity Analysis | Analysts perform sensitivity analysis on WACC inputs to assess the impact on valuation and investment decisions. |
| Interpretation | A lower WACC is generally better as it implies a lower overall cost of capital for the company. |
What is Weighted Average Cost of Capital?
The concept of Weighted Average Cost of Capital (WACC) derives from the Capital Asset Pricing Model (CAPM). This is a valuation framework developed by Jack Treynor, William Sharpe, John Lintner and Jan Mossin (“3JW”) built on earlier work by Harry Markowitz (his book portfolio Selection is brilliant) and Merton Miller. CAPM is still very influential today, Sharpe, Markowitz and Miller shared a Nobel prize for economics. Even though there are lots of valid criticisms of the CAPM and the idea of WACC, it is such a simple, elegant and useful model, it has not been supplanted.
WACC in Context
What the authors critically wanted to do was to unravel where value came from in a company. How much was to do with:
- How it was financed
- How much was to do with the fundamental profitability of the business?
- Can we create or destroy value by changing how we finance a company?
To help answer this question, 3JW chose to define the cashflow to be discounted as the “pre-financing post-tax operating cashflow”. The notional tax used in this definition is the cash tax paid on Earnings before interest and tax (EBIT). This conveniently omits the tax benefit of financing with debt- pay interest, you pay less tax (this is often called the “tax shield” in textbooks). The logical consistent definition of the discount rate then is to use the weighted average AFTER TAX cost of debt and equity. At a stroke they had separated capital structure from operating cashflow.
Key Components of WACC
The calculation of WACC involves three primary components:
- The cost of equity
- The cost of debt
- Their weights
Cost of Equity
The cost of equity represents the expected rate of return that shareholders demand for investing in a company’s equity. It reflects the risk associated with the company’s operations and the opportunity cost of (not) investing in alternative investments with similar risk profiles.
The cost of equity is calculated using the Capital Asset Pricing Model (CAPM). One can also use Gordon’s Dividend Growth Model (DGM) in principle, but a steady dividend history is needed. It is not widely used.
CAPM is a “single factor” model. The logic of the derivation of the cost of equity goes like this. If I hold a share in a portfolio of shares, the idiosyncratic risks of the individual stocks (bad weather ice cream makers go down, umbrella makers go up) get eliminated and I am left with the general riskiness of the market. i.e. my portfolio will go up and down with the market in general. In maths speak it will have the same variability (“σ”) as the market. If we drill down into my portfolio, the variability of the portfolio “σp” is just the weighted average of the variabilities of the individual stocks.
The leap the CAPM takes from there is to define the “Securities market line”: If I take no risk by buying Government bonds, then I should receive the risk-free rate (“rf”) at the moment, this is around 4.5% in dollars. If I “own the market”, by owing a market portfolio of shares, then I should get the market return (rm). In CAPM we define the “risk” of owning an asset as the variability of its return. My risk in owning the market portfolio is the variability of the value and returns on the equity markets. To put this in perspective, the long-term average return on the S&P500 is 9.24% (over 150 years) but with a standard deviation of 15%. i.e. in any year you have a roughly 60% chance of getting a return in the range 9.24% +/-15%! That’s variable.
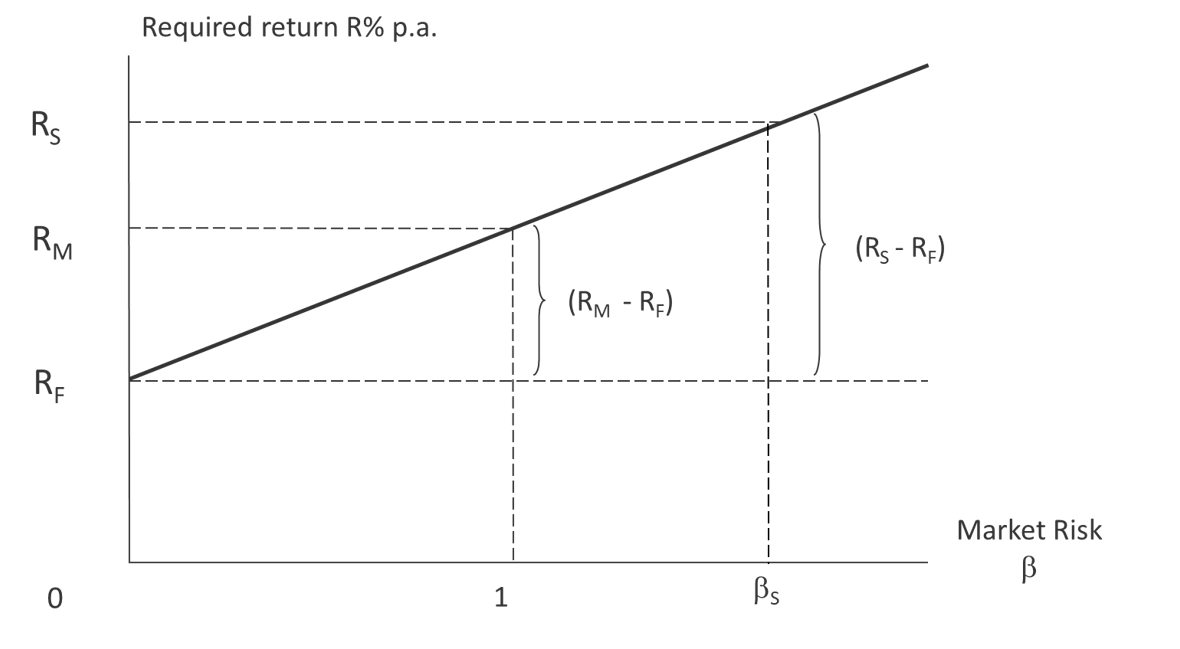
This chart shows the securities market line, the variability of the market is given the value 1 in this chart. The idea of the line is that it allows us to “price” the risk of a share. If the impact of adding a share to my portfolio is that it contributes variability, then a fair return for a share (rs) is given by the formula:
rs = rf +β*( rm – rf)
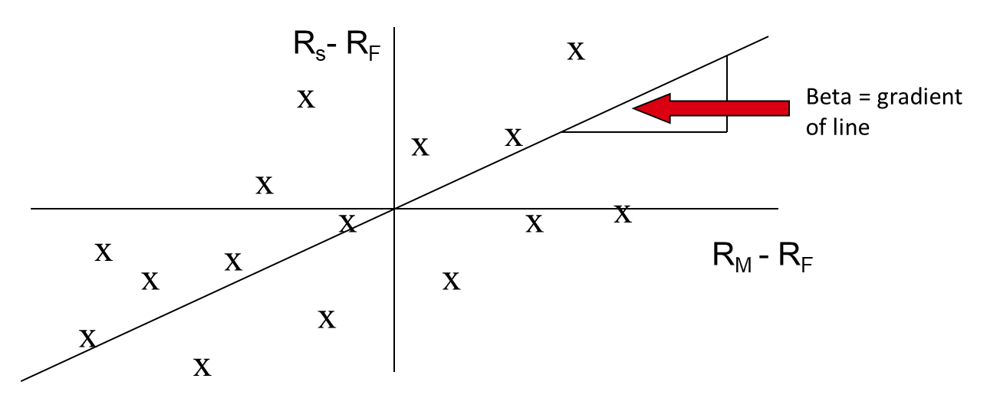
β is the relative volatility of the stock versus the market. We can measure Beta by scattering weekly excess returns from the stock vs the market and then fitting to a straight line and measuring the slope of the line.
In short if a stock is twice as volatile as the market, I should earn rf +2*( rm – rf) on the stock.
Pre-Tax Cost of Debt
The pre-tax cost of debt represents the current cost of raising new long-term debt for a company. This cost of debt typically needs to be “synthesised”.
If we unpick this, the first important point is “long-term”. Instead of taking the current cost of floating rate short term debt as a basis, we will typically take a long-term Government bond yield, i.e. a bond of 10 years or longer. The point of this is that short term rates are driven by Governments managing inflation and growth in the short run. Long-term rates reflect total returns required by lenders factoring in long-term inflation expectation.
To calculate the all-in cost, we will then need to add a “Credit-spread”, i.e. the margin that lenders will require to take the credit risk of the company.
Having established the pre-tax cost of debt, the last step is to discount this at the tax rate, i.e. multiplying by (1-Tax rate). This discount reflects the fact that interest is tax deductible, giving us the after-tax cost of debt.
Market Value of Equity and Debt
To calculate WACC, it is necessary to determine the market values of equity and debt. The market value of equity is typically represented by the company’s market capitalization, which is the total value of outstanding shares multiplied by the current share price.
The market value of debt is more complex to determine, as it depends on the specific debt instruments and their respective market values. In practice, the book value of debt is often used as an approximation, especially for privately held companies or those with limited publicly traded debt.
Market weighting value weighting is very important: The typical Price/book ratio for the S&P500 is over 4.5X. Investors are not trying to earn a return on the book value of their shares, but on the market value. Using book value would seriously underestimate the actual cost of equity.
Steps and Formula for Calculating WACC
The formula for calculating WACC is as follows:
WACC = (E / V) × Re + (D / V) × Rd × (1 – T)
Where:
- E is the market value of the company’s equity
- D is the market value of the company’s debt
- V is the total market value of the company’s capital (E + D)
- Re is the cost of equity
- Rd is the cost of debt
- T is the corporate tax rate
The steps to calculate WACC are as follows:
- Determine the market value of equity (E) and the market value of debt (D).
- Calculate the cost of equity (Re) using models like CAPM or DGM.
- Calculate the cost of debt (Rd) by dividing the interest expense by the total debt outstanding.
- Adjust the cost of debt for tax effects by multiplying it by (1 – T), where T is the corporate tax rate.
- Calculate the weights for equity (E / V) and debt (D / V) by dividing their respective market values by the total market value of capital (V).
- Multiply the cost of equity (Re) by the weight of equity (E / V) and the after-tax cost of debt (Rd × (1 – T)) by the weight of debt (D / V).
- Sum the weighted costs of equity and debt to obtain the WACC.
Interpreting WACC in Finance
The WACC has several important implications and applications in finance:
- Investment Evaluation: WACC serves as a hurdle rate or discount rate for evaluating potential investments or projects. If the expected return on an investment exceeds the WACC, it is generally considered a viable and profitable opportunity.
- Capital Budgeting: WACC is widely used in capital budgeting techniques, such as Net Present Value (NPV) analysis, to evaluate the profitability of long-term investment projects.
- Optimal Capital Structure: Companies can use WACC to determine the optimal mix of debt and equity financing that minimizes their overall cost of capital.
- Valuation: WACC is a critical component in various valuation techniques, such as the Discounted Cash Flow (DCF) method, where it is used to discount future cash flows to determine a company’s intrinsic value.
- Performance Evaluation: By comparing a company’s return on invested capital (ROIC) with its WACC, investors and analysts can assess whether the company is creating or destroying value.
Alternative WACC Calculation Methods
While the standard WACC formula is widely used, there are some alternative approaches and variations that can be considered in certain circumstances:
Target Capital Structure
Instead of using the current market values of equity and debt, some analysts prefer to use the target or optimal capital structure for the company. This approach assumes that the company aims to maintain a specific debt-to-equity ratio over the long term, which may be different from the current proportions. Using the target capital structure can provide a more forward-looking perspective on the company’s cost of capital. Large, listed companies in sectors like Supermarkets- where analysts valuations are often based largely on their DCF valuations- will often guide analysts as to their “target capital structure”.
Iterative WACC
Some analysts like to “iterate “to get a “self-consistent” WACC.
There is a potential circularity to calculating WACC:
- I calculate WACC using market value weighting.
- I produce a valuation.
- This valuation implies a different weighting of debt and equity.
- I do the valuation again using the new weightings
- This implies anew weighting… and so on forever.
Obviously, we can keep doing this many times, but typically, after one “iteration”, we have captured over 95% of the potential change from further iterations. The valuation converges very quickly to its “self-consistent” value.
Performing Sensitivity Analysis with WACC
Sensitivity analysis is a useful tool for understanding the impact of changes in the input parameters on the WACC calculation. By varying the individual components of WACC, analysts can gain insights into the sensitivity of the overall cost of capital to these changes.
Sensitivity to Cost of Equity
Analysts can examine how changes in the cost of equity (Re), such as variations in the risk-free rate, market risk premium, or the company’s beta, can affect the WACC. This analysis can help identify the key drivers of the cost of equity and their influence on the overall cost of capital. This is critical in DCF as there is tremendous subjectivity around key variables like Beta.
Sensitivity to Cost of Debt
Similarly, the sensitivity of WACC to changes in the cost of debt (Rd) can be analysed. Factors like interest rate fluctuations, changes in the company’s credit rating, or modifications to the debt structure can impact the cost of debt and, consequently, the WACC.
Sensitivity to Capital Structure
Exploring the sensitivity of WACC to changes in the capital structure, represented by the weights of equity (E/V) and debt (D/V), can provide valuable insights. This analysis can help determine the optimal capital structure that minimizes the overall cost of capital.
Scenario Analysis
By combining sensitivity analyses on multiple input parameters, analysts can create different scenarios to assess the impact on WACC on valuation and establish a range of “fair value”. This can include stress-testing the WACC under various market conditions, leverage ratios, or growth assumptions, providing a more comprehensive understanding of the company’s cost of capital and its implications for investment decisions and valuation.
Examples and Case Studies for WACC
To illustrate the practical application of WACC, let’s consider a few examples and case studies:
Example 1: Company A
Market value of equity: $100 million
Market value of debt: $50 million
Cost of equity (Re): 12%
Cost of debt (Rd): 6%
Corporate tax rate (T): 25%
Using the WACC formula:
- WACC = (100 / 150) × 12% + (50 / 150) × 6% × (1 – 0.25)
- WACC = 0.667 × 12% + 0.333 × 4.5%
- WACC = 8% + 1.5%
- WACC = 9.5%
Company A’s WACC is 9.5%, which means that any investment or project with an expected return higher than 9.5% would be considered profitable and value-creating.
Case Study: Apple Inc.
In 2022, Apple Inc. reported a market capitalization of $2.37 trillion and a total debt of $120.1 billion. Analysts estimated Apple’s cost of equity to be around 9% and its after-tax cost of debt to be approximately 2.5%.
Using these figures, Apple’s WACC can be calculated as follows:
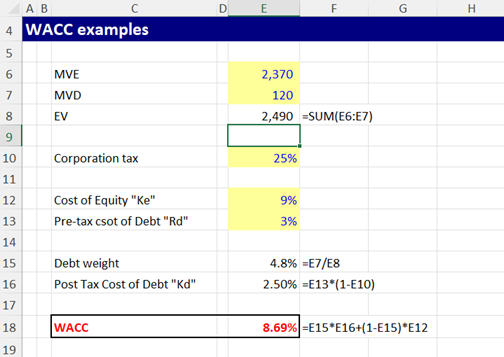
With a WACC of 8.69%, Apple can evaluate potential investments and projects based on this hurdle rate, ensuring that only those with expected returns exceeding 8.69% are considered value-creating.
WACC FAQs

Former banker turned entrepreneur. I successfully restructured, purchased, managed and sold a private engineering group, Steel Line Ltd, through an LBO and was also an equity partner in Corporate Training Group which my partners and I successfully sold to the AIM listed ILX group in 2006. I established Capital City Training Limited in early 2010 with my business partner Greg. We acquired MS Consultants a few years ago (so I’m still doing a bit of M&A). I have had non-exec roles for a small and growing VA/recruitment business and a fast-growing beverage logistics company. I am also an active investor.
Capital City Training is a full service technical and management development training company focused on the banking, wealth management and broader financial services and accounting industries. Having said all that, in the last couple of years we’ve been branching out into training for non-financial companies – manufacturing, retail, tech, defense.. so old and new economy. We also provide consultancy around modelling and are currently working for a leading PPP/PFI advisory firm. We have delivered training in every continent of the world in 2024… except Antarctica. Perhaps in 2025?! Watch this space.
Capital’s dedicated faculty combine extensive line experience as corporate financiers, bankers, traders, portfolio managers and equity analysts together with over 60 years of experience in learning and development as both procurers and providers of tailored in-house training, eLearning and blended learning. Our faculty also includes experienced Management development training specialists allowing us to provide HR consultancy services, management development training and also innovative integrated management development & technical training events. Capital City’s faculty embody over 100 years of line experience across the fields of accounting, corporate finance, derivatives, credit, lending, investment, equity research transaction banking and origination.