Breakeven Point: Definition, Formula and Analysis
In the world of business, profitability is the ultimate goal. Companies strive to generate revenue that exceeds their expenses, allowing them to turn a profit and sustain their operations. Breakeven is exactly what it says it is, but breakeven on what basis? Are we at monthly breakeven in profit terms; at monthly Cash breakeven, at overall investment breakeven – where we have recovered all our investment costs? The main type of Breakeven Points we look at are:
- Profit breakeven: Costs before tax = revenues
- Cash breakeven: cash operating costs before tax = revenues
- Overall breakeven: profits to date = total equity invested
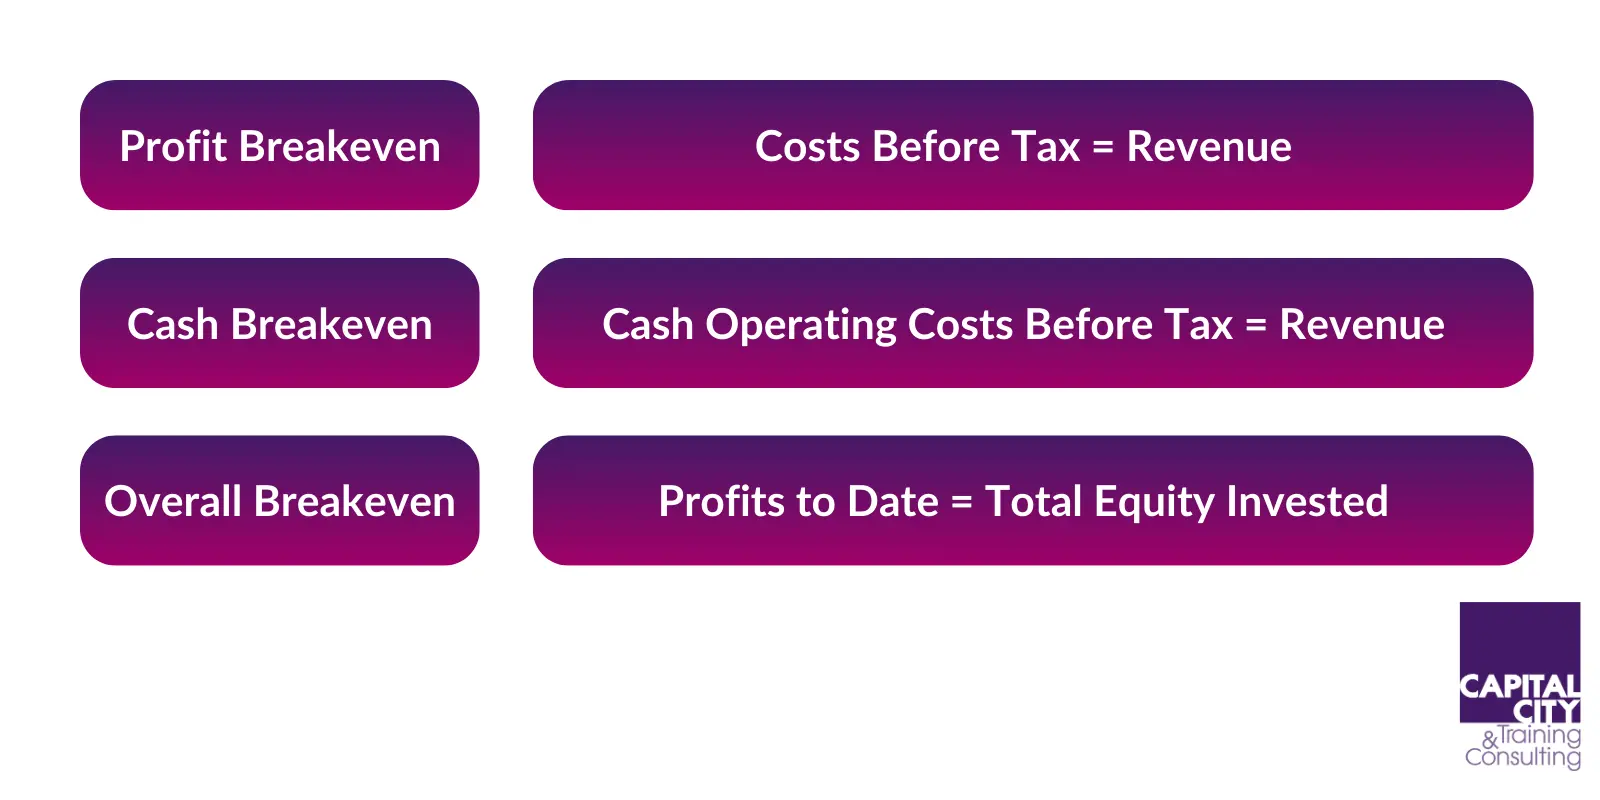
These are all quite different.
Understanding the breakeven point is crucial for any business seeking to make informed decisions, manage risks, and chart a path towards sustainable growth. It is important for startups planning and budgeting, for companies investing in new ventures and for companies in distress who are planning cost cuts.
Article Contents
- What is the difference between cash and profit breakeven?
- Breakeven Point Formula and Calculation
- Calculating the Contribution Margin
- Break-even Points in Multi-Product Scenarios
- What is a Breakeven Analysis
- How to Conduct a Breakeven Analysis
- Interpreting the Breakeven Point in Business
- Uncertainty and Risk Factors in Break-Even Analysis
- Break Even Point Case Studies and Examples
Key Takeaways
| Aspect | Description |
| Definition | The point where a company’s total revenue equals its total costs, resulting in zero net profit or loss. |
| Types of Breakeven |
|
| Breakeven Point Formula |
|
| Fixed vs Variable Costs | Fixed costs remain constant regardless of output (rent, salaries). Variable costs fluctuate with production/sales levels (materials, labor). |
| Contribution Margin | Revenue left over after deducting variable costs, used to cover fixed costs and generate profit. |
| Multi-Product Scenarios |
|
| Breakeven Analysis | Evaluate relationship between costs, sales, and profitability. Assess viability of new products/services. |
| Interpreting Breakeven | Represents profitability threshold, aids pricing/cost decisions, capacity planning, goal setting. |
| Uncertainties and Risks | Demand changes, cost volatility, competition, operational risks can impact breakeven point. |
| Case Studies | Examples illustrating breakeven calculations for new product line and service business expansion |
What is the difference between cash and profit breakeven?
The cash breakeven point usually occurs first for a startup company: a company may have made a significant investment in fixed assets and consequently have monthly depreciation charges. These will have to be covered to get to a profit, but cash breakeven , when we cover cash costs from revenue is a critical point: we’ve stopped the “cash burn.” We won’t need to extend borrowings or raise new cash. Most startups never reach this stage, two thirds of startups fail within their first 18 months!
Cash breakeven is a critical point for a business, but it doesn’t mean the business is viable in the longer term. Long-term viability will only be achieved when profit breakeven is achieved and then exceeded, giving profits which can, after tax, give a return to shareholders and fund further investment in the business.
A much more useful way to think about breakeven is to develop the simple formulae above and consider what level of unit sales that we will have to achieve in order to breakeven.
Breakeven Point Formula and Calculation
The profit breakeven point is typically expressed in terms of units sold or revenue generated. It can be calculated using a straightforward formula:
Break Even unit sales = Fixed Costs / (Sales Price per Unit – Variable Cost per Unit)
Alternatively, the breakeven point can be calculated in terms of revenue:
Break Even Point (in revenue) = Fixed Costs / (1 – Variable Cost per Unit / Unit Price)
The breakeven point formula involves three key components: fixed costs, variable costs, and sales price (or revenue).
- Fixed Costs: These are expenses that remain constant regardless of the level of production or sales, such as rent, insurance, depreciation, promotion and salaries. Fixed costs do not change with changes in output.
- Variable Costs: These are expenses that fluctuate directly with the level of production or sales, such as raw materials, direct labour, and commissions. Variable costs increase or decrease in proportion to the output.
- Sales Price (or Revenue): This is the amount charged for each unit sold or the total revenue generated from sales.
By substituting these components into the breakeven point formula, businesses can determine the minimum level of sales or production required to cover their total costs.
To calculate the cash breakeven, we just need to exclude depreciation from the fixed costs. Cash breakeven is important, but it is only a matter of stepping stone to success; companies go bust when they run out of cash. What about repaying loans from friends and family? This won’t happen at cash breakeven. Neither will a profit.
Calculating the Contribution Margin
The contribution margin represents the amount of revenue left over after deducting variable costs from sales revenue. It’s used to cover fixed costs and generate profit.
The contribution margin can be calculated using the following formula:
Contribution Margin = Sales Revenue – Variable Costs
Alternatively, it can be expressed as a percentage:
Contribution Margin Ratio = (Sales Revenue – Variable Costs) / Sales Revenue
The contribution margin plays a crucial role in the breakeven point formula, as it represents the amount of revenue available to cover fixed costs before generating profit.
Break-even Points in Multi-Product Scenarios
In many businesses, companies offer multiple products or services, each with its own set of costs and revenue streams. In such cases, calculating the overall break-even point becomes more complex, as it involves considering the combined effects of various product lines.
There are two main approaches to calculating the break-even point in multi-product scenarios:
Product Line Break-Even Point
This approach involves calculating the break-even point for each individual product line separately, considering its specific fixed costs, variable costs, and sales price. The overall break-even point for the company is then determined by summing the individual break-even points for each product line.
To calculate the product line break-even point, use the following formula:
Break-Even Point (in units) = (Product Line Fixed Costs) / (Sales Price per Unit – Variable Cost per Unit)
Combined Break-Even Point
This approach involves calculating a single, overall break-even point for the entire company, considering the combined fixed costs, total sales revenue, and total variable costs across all product lines.
To calculate the combined break-even point, use the following formula:
Combined Break-Even Point (in revenue) = Total Fixed Costs / (1 – (Total Variable Costs / Total Sales Revenue))
The combined break-even point approach provides an aggregate view of the company’s overall profitability threshold but won’t offer insights into the performance of individual product lines.
When analysing multi-product scenarios, businesses should consider the following factors:
- Product Mix: The relative contribution of each product line to total sales and costs can significantly impact the overall break-even point. Changes in the product mix may require adjustments to the break-even analysis.
- Resource Allocation: In some cases, fixed costs may be shared or allocated across multiple product lines, requiring careful consideration of how these costs are attributed to each line.
- Cannibalization Effects: The introduction of new products or services may cannibalize sales of existing offerings, potentially impacting the overall break-even point.
- Product Life Cycles: Different product lines may be at various stages of their life cycles, with varying cost structures and revenue potential, affecting the break-even analysis over time.
What is a Breakeven Analysis
A breakeven analysis is a powerful tool used by businesses to evaluate the relationship between costs, sales volume, and profitability. It helps companies determine the minimum level of sales or production required to cover all expenses and begin generating profit.
The breakeven analysis involves calculating the breakeven point and then examining various scenarios and variables that could impact profitability. This analysis allows businesses to assess the viability of new products and services.
By conducting a breakeven analysis, companies can make informed decisions about pricing strategies, marketing efforts, production levels, and resource allocation, ultimately increasing their chances of success and profitability.
How to Conduct a Breakeven Analysis
Conducting a breakeven analysis involves the following steps:
- Identify and categorize costs: Carefully separate fixed costs from variable costs, as this distinction is crucial for accurate calculations.
- Determine the sales price or revenue: Establish the price at which the product or service will be sold, or estimate the total revenue expected from sales.
- Calculate the contribution margin: Subtract variable costs from the sales price or revenue to determine the contribution margin.
- Calculate the breakeven point: Use the breakeven point formula to determine the level of sales or production required to cover all costs.
- Perform sensitivity analysis: Analyse how changes in variables, such as sales price, costs, or demand, would impact the breakeven point and profitability.
- Interpret the results: Evaluate the breakeven point in relation to the company’s goals, market conditions, and competitive landscape.
- Develop strategies: Based on the analysis, develop strategies to increase sales, manage costs, or adjust pricing to achieve profitability.
Interpreting the Breakeven Point in Business
The breakeven point provides valuable insights into a company’s operations and profitability:
- Profitability threshold: The breakeven point represents the minimum level of sales or production required to avoid losses. Any sales or production above this point will generate profit, while any amount below will result in a loss.
- Risk assessment: A high breakeven point indicates a higher level of risk, as the company needs to achieve a substantial level of sales or production to cover its costs and become profitable.
- Pricing and cost management: The breakeven point analysis can help businesses evaluate the impact of pricing strategies and cost management initiatives on profitability.
- Capacity planning: By understanding the breakeven point, companies can make informed decisions about production capacity, inventory levels, and resource allocation.
- Benchmarking and goal setting: The breakeven point can be used as a benchmark for setting sales targets, production goals, and profitability objectives.
Uncertainty and Risk Factors in Break-Even Analysis
While the break-even analysis is a valuable tool for decision-making, it is essential to consider the underlying assumptions and potential uncertainties that may impact the results. By incorporating risk factors into the analysis, businesses can better prepare for various scenarios and mitigate potential risks.
- Demand Uncertainty: The break-even analysis assumes a certain level of demand for the product or service, but market conditions can fluctuate, leading to changes in actual sales volumes. Conducting sensitivity analyses by varying demand levels can help businesses understand the impact of demand uncertainty on the break-even point.
- Cost Volatility: Both fixed and variable costs are subject to potential changes over time due to factors such as inflation, supply chain disruptions, or changes in input prices. Businesses should consider the potential impact of cost volatility on the break-even point and profitability.
- Competitive Dynamics: The break-even analysis typically assumes a static competitive environment, but in reality, competitors’ actions, new entrants, or changes in consumer preferences can significantly impact sales and pricing strategies, affecting the break-even point.
- Operational Risks: Unforeseen events, such as equipment breakdowns, labour disruptions, or supply chain issues, can impact production levels and variable costs, potentially shifting the break-even point.
To address these uncertainties and risk factors, businesses can employ various techniques:
- Scenario Analysis: Develop multiple scenarios (best-case, worst-case, and most likely) by varying key assumptions, such as sales volumes, prices, and costs, to understand the range of potential break-even points.
- Sensitivity Analysis: Perform sensitivity analyses by changing one variable at a time (e.g., sales price, variable costs) to determine the impact on the break-even point and identify critical variables.
- Risk Management: Implement risk management strategies, such as diversification, hedging, or contingency planning, to mitigate the impact of potential risks on the break-even point.
- Continuous Monitoring: Regularly review and update the break-even analysis to reflect changes in market conditions, cost structures, or operational factors, allowing for timely adjustments to strategies.
By incorporating uncertainty and risk factors into the break-even analysis, businesses can make more informed decisions, anticipate potential challenges, and develop contingency plans to navigate various scenarios effectively.
Break Even Point Case Studies and Examples
Case Study 1: Launching a New Product Line
A manufacturing company plans to introduce a new product line and wants to assess its potential profitability. The company estimates fixed costs of £250,000 for the new product line, including equipment, marketing, and overhead expenses. The variable costs per unit are projected to be £15, and the product will be sold for £30 per unit.
To calculate the break-even point in units, the company uses the following formula:
Break Even Point (in units) = Fixed Costs / (Sales Price per Unit – Variable Cost per Unit)
- = £250,000 / (£30 – £15)
- = 16,667 units
This means the company needs to sell 16,677 units of the new product to breakeven and cover all its costs. Any sales beyond this point will generate profit.
Case Study 2: Evaluating a Service-Based Business
A consulting firm is considering expanding its operations and wants to determine the break-even point for its new office location. The firm estimates fixed costs of £80,000 per year, including rent, utilities, and administrative expenses. The average hourly rate for consulting services is £150, and the variable costs (primarily labour costs) are estimated at £60 per hour.
To calculate the break-even point in revenue, the corrected formula is used:
Break Even Point (in revenue) = Fixed Costs / Contribution Margin Ratio
Where Contribution Margin Ratio = (Sales Price per Unit – Variable Cost per Unit) / Sales Price per Unit
- = £80,000 / ((£150 – £60) / £150)
- = £133,333
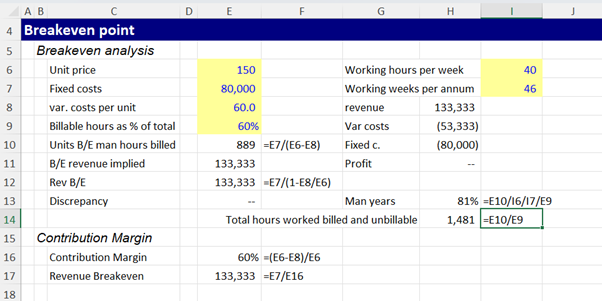
The consulting firm needs to generate approximately £133,333 in revenue from its new office location to breakeven and cover all its costs. Any revenue above this amount will result in profit.

Breakeven Point FAQs

Former banker turned entrepreneur. I successfully restructured, purchased, managed and sold a private engineering group, Steel Line Ltd, through an LBO and was also an equity partner in Corporate Training Group which my partners and I successfully sold to the AIM listed ILX group in 2006. I established Capital City Training Limited in early 2010 with my business partner Greg. We acquired MS Consultants a few years ago (so I’m still doing a bit of M&A). I have had non-exec roles for a small and growing VA/recruitment business and a fast-growing beverage logistics company. I am also an active investor.
Capital City Training is a full service technical and management development training company focused on the banking, wealth management and broader financial services and accounting industries. Having said all that, in the last couple of years we’ve been branching out into training for non-financial companies – manufacturing, retail, tech, defense.. so old and new economy. We also provide consultancy around modelling and are currently working for a leading PPP/PFI advisory firm. We have delivered training in every continent of the world in 2024… except Antarctica. Perhaps in 2025?! Watch this space.
Capital’s dedicated faculty combine extensive line experience as corporate financiers, bankers, traders, portfolio managers and equity analysts together with over 60 years of experience in learning and development as both procurers and providers of tailored in-house training, eLearning and blended learning. Our faculty also includes experienced Management development training specialists allowing us to provide HR consultancy services, management development training and also innovative integrated management development & technical training events. Capital City’s faculty embody over 100 years of line experience across the fields of accounting, corporate finance, derivatives, credit, lending, investment, equity research transaction banking and origination.